

1. Introduction
Electrochemical conversion of CO2 into liquid fuels and chemicals is considered to be one of the most promising ways to combat climate change by lowering atmospheric CO2 concentrations [1⇓⇓⇓-5]. Formic acid (HCOOH) is a valuable liquid product of the CO2 reduction reaction (CO2RR), which has gained considerable attention in energy transition scenarios where finding appropriate storage solutions remains an important challenge [6⇓-8]. Some of the main group metal such as Sn, In, Bi, Pb, and their oxides catalyze CO2RR to formic acid with high Faradaic efficiency (FE) [9⇓⇓⇓⇓⇓⇓⇓⇓-18]. Particularly, Sn-based materials have been identified as attractive electrocatalysts for selectively reducing CO2 to formate due to their high activity, good selectivity, low cost, non-toxicity, and the abundance of Sn in the Earth's crust relevant to large-scale applications [19,20]. For example, a recent work revealed that SnO2 electrocatalysts displayed FEs higher than 93% at a current density of 10.2 mA cm‒2 [21,22]. In another study, it was claimed that the promising activity of a nanostructured SnO2 catalyst is due to the presence of grain boundaries, oxygen vacancies and low-coordinated surface Sn sites [23]. The beneficial role of hydroxyl groups at the surface of Sn-oxides to achieve high CO2RR activity and HCOOH selectivity has also been discussed [24]. Another possible approach is to dope SnO2 with other metals. For instance, metal-doped SnO2 electrocatalysts contained more surface oxygen vacancies and exhibited a higher FE than undoped SnO2 [15].
The nature of the active sites and the mechanism of CO2RR have also been studied, mainly using density functional theory (DFT) calculations [25,26]. Jaramillo's group [27] used DFT to describe the mechanism and key reaction intermediates aiming at understanding experimentally observed differences between Sn, Ag, Au, Cu, Zn, Pt and Ni metal catalysts used for CO2RR. Gong and co-workers [28] found that a moderate concentration of oxygen vacancies in Sn-oxide results in a more active surface and inhibits the undesirable hydrogen evolution reaction (HER). Furthermore, a recent computational study employing a SnO/Sn(112) surface model showed that surface OH* species are beneficial for CO2RR to formic acid [25]. So far, computational studies dealing with CO2RR to formic acid did not employ simulations considering complete reaction networks to predict the overall electrochemical performance nor explore descriptors related to the adsorption free energy of intermediates for high CO2RR activity and HCOOH selectivity, which can be useful to identify improved catalysts. In this respect, a comprehensive study of the impact of metal doping on SnO2 on the CO2RR is lacking.
In the current work, we present DFT calculations combined with microkinetics simulations to investigate the electrochemical CO2RR to formic acid on a SnO2 electrode. We investigated the impact of doping SnO2 with various metals (Ni, Pd, Bi, and Cu). We first studied the adsorption of CO2 on a SnO2 model and metal-doped counterparts, followed by considering possible elementary reactions steps for CO2RR to formic acid (HCOOH). We mainly considered hydroxylated surfaces as we found the stoichiometric SnO2 surface to be unreactive. The hydroxyl groups play a key role in the formation of the *COOH intermediate. A clear Brønsted-Evans-Polanyi relation for CO2 to *COOH and *COOH to HCOOH steps is identified for the different metal dopants on SnO2. Our study identifies Bi as the most promising dopant, not only facilitating *COOH formation but also increasing the overall CO2RR activity to HCOOH. Microkinetics simulations of the electrochemical CO2RR as a function of potential in a computational rotating disc electrode configuration were performed to predict the performance of undoped and Bi-doped SnO2(110). The results emphasize the promoting effect of Bi on SnO2 in the CO2RR to formic acid.
2. Computational methods
2.1. DFT calculations
Spin-polarized DFT calculations were conducted using the Vienna Ab Initio Simulation Package (VASP 5.4.4) [29]. The ion-electron interactions were modeled using the projector-augmented wave (PAW) method [30], while the electron exchange-correlation was described using the Perdew- Burke-Ernzerhof (PBE) functional within the generalized gradient approximation (GGA) [31]. A plane-wave basis set with an energy cutoff of 400 eV was employed. To ensure convergence, the ionic steps during geometry optimization were terminated when the forces on each atom were below 0.05 eV/Å, and the convergence threshold was set to 1 × 10⁻⁵ eV. After geometry optimization, frequency analysis was performed to confirm that the optimized structures were genuine minima. Van der Waals interactions determined via the DFT-D3 method were considered in all the calculations [32].
For modeling the SnO2(110) surfaces, a periodic slab of SnO2 was utilized with a (2 × 2) surface supercell that included four layers, with the bottom two layers being fixed. For the calculations of metal-doped SnO2(110) (metals considered: Ni, Pd, Bi, and Cu) models, we used a periodic slab with a SnO2(110) supercell in which one of the surface Sn atom in the top layer was replaced by a metal atom. These structures are denoted by M-SnO2(110) with M being the substituting metal. To avoid any self-interactions, a vacuum of 15 Å was introduced between the neighboring slabs. For the clusters, the Brillouin zone sampling was limited to the Γ-point, while a Monkhorst-Pack k-point mesh of 4 × 3 × 1 was employed for the periodic surfaces. Initially, we considered the stoichiometric oxygen-terminated surface and also the fully hydroxylated surface. For the latter purpose, we added four H atoms to bridging oxygen (Obri) at the top layer, resulting in SnO2‒x(OH)4 models. Such hydroxylated surface were earlier found to be more stable than the oxygen-terminated surfaces [28].
The DFT calculations were performed using the computational hydrogen electrode (CHE) approach developed by the Nørskov's group [33], with implicit solvation effects taken into account using VASPsol [34] software package. This software incorporates solvation effects into VASP calculations through a self-consistent continuum model, providing a cost-effective and straightforward method for incorporating solvent effects. VASPsol has been employed before to consider the solvent in the description of electrochemical systems in a cheap and simple manner [35]. For this purpose, we supplemented the electronic energy computed via DFT with the energies arising from the electrostatic interactions between the solute and the solvent, as well as the cavitation energy required to form the solute within the solvent. We chose water as the solvent in our study, which has a dielectric constant of 78.4.
We evaluated the thermodynamic properties using our previous research [35]. Specifically, we calculated the Gibbs free energy change (∆G) at 298.15 K and 1 atm using
where ∆EDFT represents the electronic energy of CO2RR intermediates, while ∆EZPE denotes their zero-point vibrational energy, ∆GU is calculated as ‒eU where e represents the elementary charge and U signifies the electrode potential, ∆GpH is the correction of the free energy of protons their concentration such that ΔGpH = 2.303 × kBT × pH with the pH taken as zero here, and ΔGfield is contribution to the free energy of the electric field originating from the electrochemical double layer. Similar to previous studies [33], ΔGfield was neglected in this work with typical values of ΔGfield being 0.015 eV. CP is the heat capacity at constant pressure, ∆S represents the entropy change at a given temperature T and the integration terms are computed using the vibrational energies of CO2RR intermediates. The entropies of gas-phase molecules in their free state were obtained from the NIST-JANAF thermochemical tables [36].
The free energy of adsorption was computed by
where Gfacet+g, Gfacet, and Gg represent the free energies of a particular species adsorbed on the surface, the empty surface and the corresponding gas-phase species, respectively.
2.2. Barriers for the potential-dependent reactions
The electrochemical CO2RR mechanism consist of two types of reactions that occur after the adsorption of CO2 on the SnO2 surface. The first type is potential-dependent elementary reactions that involve a series of proton-coupled electron transfer (PCET) steps in the associative pathway, which are electrochemical reactions. The second type is potential-independent elementary reactions, which are non-electrochemical reactions [37].
For reactions involving proton and electron transfer,
the free energies of the reactions were calculated using the CHE model previously described [33]. In this model, the standard hydrogen electrode (SHE) is used as the reference potential, which is set to 0 V. Under the potential, the reaction H+ + e‒ ⇋ ½H2 reaches equilibrated at a temperature of 298 K, with a pH of 0 and a pressure of 1 bar gaseous H2. To attain a potential of 0 V vs. the reversible hydrogen electrode (RHE) at varying pH values, the potential can be adjusted by -0.06 × pH. The equilibrium potential at pH 6.8 is -0.4 V vs. SHE. Although the free energy of the reaction remains pH-independent when measured against the RHE, the barriers can vary with pH while maintaining a constant potential relative to RHE. As a results, all the energy barriers were established relative to the SHE potential. The chemical potential of the proton-electron pair can be evaluated at 0 V vs. SHE through the use of DFT and statistical mechanics principles, which allow the determination of the free energy of gaseous H2. The dependence of the proton-electron pair's free energy on the electrode potential can be easily determined using the linear relationship between electron energy and potential, with a shift in electron energy represented by -eU. This is represented by the equation
here e represents the elementary positive charge and U is the electrode potential on the SHE scale. Additionally, the free energy change of a particular electrochemical reaction, ΔG, can be expressed as
here ΔG0 refers to the reaction free energy at 0 V vs. SHE, while U is the potential measured vs. SHE.
We utilized the method introduced by Akhade et al. [38] to calculate potential-dependent kinetics. The activation energy (Ga) for non-electrochemical surface hydrogenation reaction
can be determined through DFT calculations. The activation energy for the electrochemical step corresponding to the aforementioned reaction occurs under conditions where H+ + e‒ + * ⇌ H*. The value of the activation energy Ga(U0) for A* + H+ + e‒ ⇌ AH* is equals to Ga, where U0 represents the equilibrium potential at which the non-electrochemical state, μ(H*), is in balance with its equivalent electrochemical state, μ(H+(aq) + e‒) [37]. U0 corresponds to the hydrogen adsorption free energy (ΔGH) for a particular surface at 0 V vs. RHE. To calculate the free energy change for the electrochemical surface hydrogenation, we can use the equation U0 = [G(AH*)-G(A*)-1/2G(H2)]/e. We utilize the Butler-Volmer formalism to describe the forward activation energy at an electrode potential U [38],
here n represents the number of electrons transferred. Similarly, we can calculate the backward activation energies using the equation
We also considered electrochemical steps that are potential-dependent, of the form
To determine the activation barriers for these reactions, we refer to the work of Liu et al. [40] and specifically adopted the same values we used for our corresponding reactions in equation 3, with the exception of the Volmer and Heyrovsky barriers. We adjusted the values of these barriers to account for the experimentally observed lower rate of hydrogen evolution through water reduction compared to proton reduction. Both types of reactions are affected similarly by changes in applied potential vs. SHE, indicating similar effective symmetry factors. However, the effect of changes in pH differs for the two reactions, since H+ is a reactant in equation 3, while OH‒ is a product in equation 4. Specifically, increasing the pH will decrease the rate of proton reduction but will not affect the forward rate of water reduction. Consequently, an increase in pH at a constant potential vs. RHE will result in a decrease in proton reduction and an increase in water reduction [41].
2.3. Microkinetics modelling
Microkinetics simulations were performed using MKMCXX software package to study the electrochemical CO2RR [42]. The methodology for these simulations has been previously described [43]. For each electrochemical reaction step, i, the rate constants are assumed to follow the functional form of Eq. (10)
here Ai represents an effective pre-factor. To simplify the simulations, we have employed a pre-factor to kBT/h s‒1 for all surface elementary reaction steps. This approach is reasonable for reactions involving intermediates that are strongly bound to the catalyst surface. However, we acknowledge that this approximation may not accurately capture reactions involving free protons, and the pre-factor could vary with the applied potential in real systems. Hence, it is recommended that the rate constants derived from our study be considered qualitative rather than quantitative in nature. The non-electrochemical reaction steps were characterized using a similar manner but without the potential dependency
The active site area of 2.09 × 10‒19 m2 was determined from the surface area of the supercell (3.18 Å × 6.58 Å), assuming one active site per supercell. For simulating the HER on the SnO2 electrode, we used literature data. In our simulations, we considered the exchange current density for the HER on a Sn-based electrode (at 0 V vs. SHE) to be approximately 0.2 × 10‒3 mA/cm2 [44]. This value was used to model activated hydrogen evolution with an energy barrier of 102.1 kJ/mol. To address the decreased availability of H+ near the electrochemical surface at high current densities and overpotentials, we introduced a diffusion layer between the bulk solution and the catalyst surface [45,46]. We used the diffusion coefficient of 9.31 × 10‒9 m2/s for H+ in water [44] and determined the thickness of the diffusion layer using the Levich Eq. [47].
wherein the diffusion layer thickness (δ) was calculated from the kinematic viscosity of the solution (υ = 8.93 × 10‒7 m2/s) and the rotation rate of the rotating disc electrode (ω). The concentrations were then solved simultaneously with the surface kinetics using Fick's second law of diffusion perpendicular to the surface
where c is the concentration, x the distance with respect to the catalytic surface, and D the diffusion constant. To discretize the diffusion layer, we employed a 3-point 2nd order central difference scheme and used 50 grid points. CO2 (D = 2 × 10‒9 m2/s) and OH‒ (D = 5.27 × 10‒9 m2/s) diffusion were considered in the simulation, using the same diffusion layer thickness as H+ as a first approximation [48]. The water reduction reaction (A + H2O + e‒ → AH + OH‒) may start to dominate over the proton reduction mechanism at high overpotential due to the increase in effective surface pH. Therefore, all elementary reaction steps involving hydrogen following the proton reduction mechanism, as well as the water reduction mechanism, were included. To simulate the experimental conditions of water at 298 K and 1 bar CO2, we employed a solvated CO2 concentration of 0.033 mol/L [49].
To make the current study computationally tractable, we did not consider the effect of a double layer explicitly. As an example, we mention the study of Feliu's group who explored such effects on the polarization behavior of hydrogen peroxide reduction and oxidation on Pt(111) [50]. We employed a constant electron model in our computational simulations of the CO2RR. This model was selected based on considerations such as computational expense and the complexity associated with constant potential models [51]. While the constant potential model can offer a more realistic description of the system under study, it typically demands more computational resources and it is more complex to interpret the results [51].
To determine the FE, we divided the partial current for each product by the total current, using the following equation:
In this equation, zi represents the number of electron transfers required for production of i, ri is the rate of production of i, and re- denotes the overall rate of electro consumption. Additionally, we also conducted a sensitivity analysis for each elementary reaction step to assess the degree of rate control (DRC) [52]:
3. Results and discussion
3.1. CO2 adsorption and CO2RR
The basic structural model adopted on this study is the hydroxylated SnO2(110) surface depicted in Fig. 1 and S1. The choice for 4 OH groups per unit cell is based on an earlier DFT study by Gong et al. [28], who showed that the SnO2(110) surface model with 4 OH groups is a stable state when reducing the SnO2(110) surface. We verified that CO2RR to formic acid on the stoichiometric SnO2(110) presents high barriers for the hydrogenation of CO2 (Fig. S2). To investigate the mechanism of the CO2RR on SnO2‒x(OH)4, we start by considering CO2 adsorption on the hydroxylated surface.
Fig. 1.
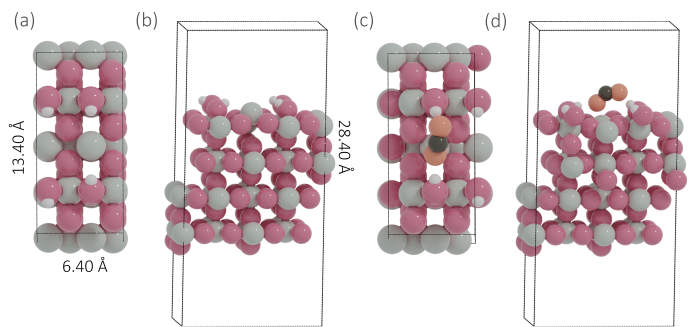
Fig. 1.
Top view (a) and side view (b) of the SnO2‒x(OH)4 model, top view (c) and side view (d) of the most stable adsorption configuration of CO2 on SnO2‒x(OH)4 (gray = Sn, red = O atoms of SnO2‒x(OH)4, orange = O of CO2, black = C, white = H).
As shown in Fig. 1, CO2 can adsorb on the SnO2‒x(OH)4 surface forming an activated bent configuration (O‒C‒O bond angle 136.7°). This adsorption step is slightly endergonic with a reaction free energy of +0.12 eV (Fig. 2). In its stable state, CO2 binds to the surface in a bidentate configuration with one O atom binding to a Sn cation (Sn…O bond distance 2.31 Å) and interacting with one of the OH groups (O…H bond distance 1.91 Å). The distance between the other O atom of CO2 and the proximate H atom is 1.73 Å. We then considered the (electrochemical) hydrogenation steps CO2 + H → HCOO and CO2 + H → COOH. The corresponding initial, transition and final states of this and other reactions considered are shown in Fig. 3. The H atoms are transferred from the OH groups close to the adsorbed CO2 molecule. The (free energy) barrier for the formation of adsorbed HCOO (HCOO*) is 1.84 eV, while the barrier for COOH* formation is much lower at 1.15 eV. Given the prohibitively high barrier for HCOO* formation and the relatively high barrier for HCOO* hydrogenation to HCOOH in the solution of 1.77 eV, formic acid formation via the formate pathway is not further considered here.
Fig. 3.
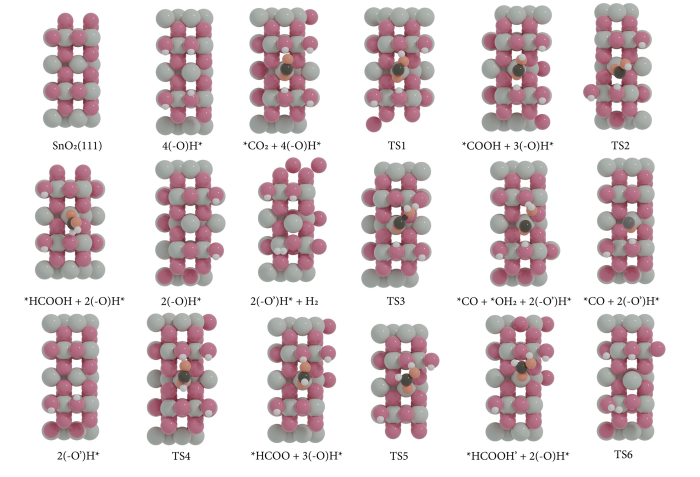
Fig. 3.
Top view of the most stable adsorption configuration of CO2RR on SnO2‒x(OH)4 (gray = Sn, red = O atoms of SnO2‒x(OH)4, orange = O of CO2, black = C, white = H).
During COOH formation, *COOH binds to the surface in a bidentate configuration with one O atom binding to a Sn cation (Sn…O bond distance 2.21 Å) and it also binds to a surface OH group (O…H bond distance 1.69 Å). Further conversion of COOH* proceeds via CO or HCOOH pathways. The activation barrier for the hydrogenation of the carbon atom in COOH* is 0.48 eV, which can lead to HCOOH (slightly endergonic with a change in Gibbs free energy of +0.13 eV). We did not find a transition state for the formation of CO* and OH*, which is a common reaction on metallic surfaces [25]. However, it is possible to hydrogenate the OH moiety in COOH*, which leads to CO* and H2O* products with an overall free energy barrier of 1.08 eV. This process is slightly endergonic with a free energy change of 0.3 eV. In all cases, the catalytic cycle is closed by hydroxylating the surface again with two H atoms from the solution via the electrochemical reaction 2(‒O)H* + 2 (e‒ + H+) → 4(‒O)H*.
Fig. 2.
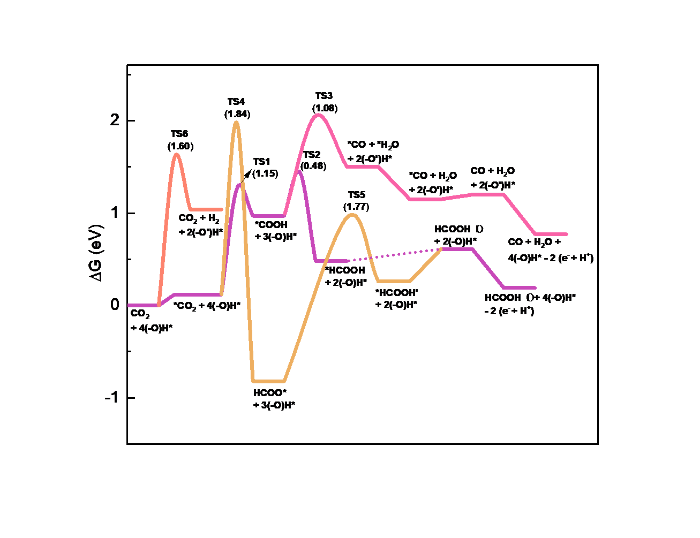
Fig. 2.
Reaction energy diagram for CO2RR on the SnO2‒x(OH)4 surface at standard conditions (T = 298.15 K, P = 1 bar, pH = 0, and 0 V vs. RHE).
In summary, the most favorable pathway towards HCOOH involves CO2 adsorption and hydrogenation to HCOOH via a COOH* intermediate without significant contribution of the HER. This is different from predictions of Yoo et al. [53], who proposed on the basis of DFT calculations for metal surfaces that selective HCOOH formation can only proceed via HCOO*. Following the identified strong linear relationship between the free energies of COOH* and H*, it would be unlikely that electroreduction of CO2 to HCOOH via the COOH* intermediate occurs without a large amount of the current being used for the HER. In our study of a Sn-oxide surface, there is a preference for COOH* formation in the first step because of the acidic character of the hydroxyl group. The finding that a COOH* pathway is possible for HCOOH formation is consistent with recent reports that combine experimental data with theoretical modeling [54⇓-56]. Besides, the HER contribution should be low due to the high barrier for H2 evolution, as we will see next.
As the HER is the main reaction that competes with CO2RR, the Gibbs free energy for H2 formation was also computed for the studied surface models (Fig. 2). The activation barrier for H2 evolution from two adjacent hydroxyl groups is 1.6 eV. This is a significantly high barrier, which is also higher than the overall barrier for HCOOH formation (1.15 eV). The high energy barrier for H2 formation on the studied surface models is consistent with the experimental observation of suppressed hydrogen formation compared to HCOOH formation on (hydroxylated) SnO2 electrodes [24].
Although we did not explore the effect of a double layer as mentioned in the methods section, we show that an ab initio molecular dynamics simulation of CO2 activation with a proton in a water layer can lead to adsorbed COOH* (Fig. S3).
3.2. Brønsted-Evans-Polanyi relations
Experimental works demonstrated that metal doping can increase the electrochemical activity and FE of Sn-based cathodes [15]. Therefore, we explored the impact of the metal dopants Ni, Pd, Bi and Cu on the reaction energetics for CO2RR on SnO2‒x(OH)4. From a practical standpoint, these elements exhibit abundant availability and low toxicity, rendering them promising candidates for industrial applications in CO2RR [57]. For this purpose, one of the surface Sn atoms was replaced by a metal dopant atom. We investigated the similar COOH*-mediated mechanism for the conversion of CO2 to HCOOH. Fig. 4 shows the reaction energy diagrams for CO2RR to HCOOH on metal-doped SnO2‒x(OH)4 surface at standard conditions. This reaction involves two elementary steps. The first step involves the binding of CO2 to the surface in a bidentate configuration and its reaction with adjacent hydrogen atoms to form COOH. Compared to the undoped case with an activation barrier of ca. 1.15 eV, the activation barriers are increased to very high values for the Pd-doped (3.31 eV) and Cu-doped (2.89 eV) SnO2‒x(OH)4 surfaces. The Ni-doped surface leads to a lower barrier of 1.75 eV. The lowest barrier of 0.93 eV obtained for the Bi-doped model is slightly lower than the barrier for the SnO2‒x(OH)4 surface. The total reaction energies for Ni, Pd and Cu dopants for the formation of COOH* were more endergonic than for the Bi dopant.
Fig. 4.
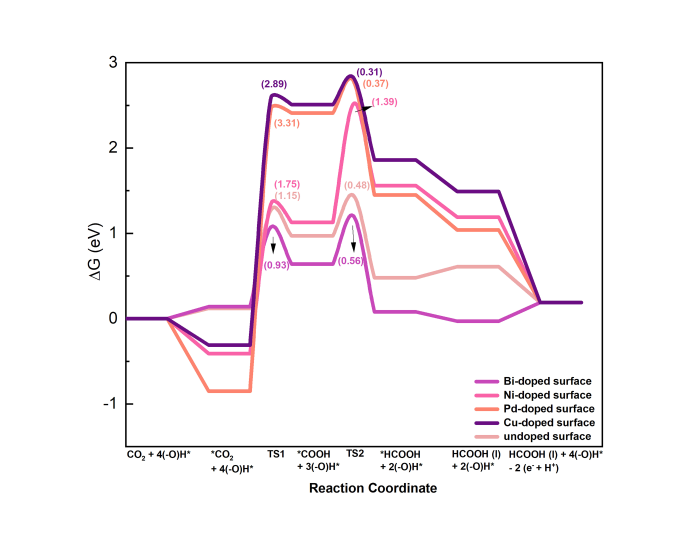
Fig. 4.
Reaction energy diagram for CO2RR on metal-doped SnO2‒x(OH)4 surface at standard conditions (T = 298.15 K, P = 1 bar, pH = 0, and 0 V vs. RHE).
The second step involves the conversion of COOH* to HCOOH*, which requires overcoming activation barriers in the range of 0.31‒1.39 eV. While the barrier for the Ni-doped surface (1.39 eV) is significantly higher than the one for the undoped surface (0.48 eV), the other dopants lead to minor changes of the barrier of HCOOH* formation. These findings identify Bi as the most promising dopant for the electrochemical reduction of CO2 to HCOOH using SnO2‒x(OH)4, because it lowers the barrier of the slow COOH* formation step.
The Brønsted-Evans-Polanyi (BEP) principle relates the (free) activation barrier to the change in the (free) reaction energy, which can be related to properties such as binding energies of stable intemediates [58⇓⇓⇓-62]. This is widely used to predict reactivity on the basis of easily accessible adsorption energies, avoiding the computation of more expensive transition states. In heterogeneous catalysis, it has been widely used in computational studies to predict periodic activity trends [63⇓-65].
Fig. 5 shows the BEP relations for the forward activation barriers of the two protonation steps that convert CO2 to HCOOH* via COOH* for the (metal-doped) SnO2‒x(OH)4 surfaces. Values of liner scaling parameter α close to unity reflect the late nature of the transition states, resembling the final state on the free energy surface along the reaction coordinate. The finding that the hydrogenation of CO2 and COOH* involves late transition states is consistent with the lateness of transition states for hydrogenation [66]. The most difficult step along the reaction coordinate is the formation of COOH*. Doping the SnO2‒x(OH)4 surface with Bi stabilizes the COOH* state and this leads due to the late character of the TS for CO2 hydrogenation to a lower activation barrier.
Fig. 5.
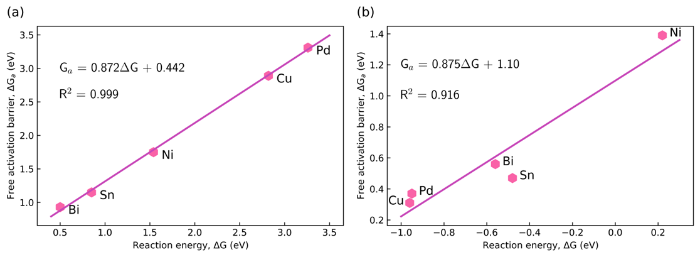
Fig. 5.
Brønsted-Evans-Polanyi plots for CO2 to COOH* step (a) and COOH* to HCOOH step (b) on metal-doped (metal = Ni, Pd, Bi, and Cu) SnO2‒x(OH)4 surfaces.
To understand how the dopant affects the performance in CO2RR, we correlated important physical and chemical properties of the dopants with respect to Sn to the activation barriers. Following earlier works [67], we included for this evaluation the number of valence electrons, the first ionization potential (IP), the electronegativity and the electron affinity, the atomic mass, and the atomic radius (Table S1). We correlated these properties to the adsorption energies of CO2 and COOH as well as the reaction energy and activation barrier for COOH* formation. Fig. 6 displays the correlation matrix ranging from positive to negative correlations. As expected, the reaction energy and activation barrier are highly correlated in line with the BEP relation in Fig. 5(a). Besides, the parameter that strongest positive correlates with the activation barrier is the adsorption energy of COOH followed by the IP. Thus, these data indicate that metal dopants with lower adsorption energies of COOH and lower IP can help reducing the activation barrier.
Fig. 6.
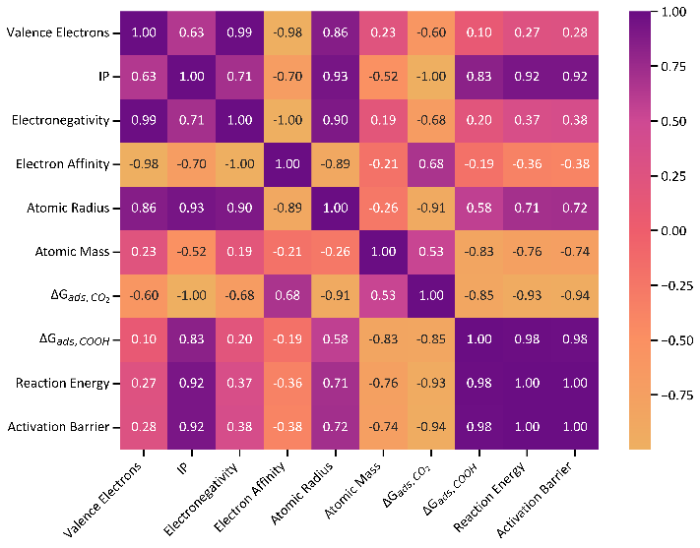
Fig. 6.
Correlation matrix between properties of the dopant metal and the reaction energy and activation barrier for the elementary reaction step CO2* + H* → COOH* + *. Positive values indicate positive correlations, while negatives ones anticorrelations between the parameters.
3.3. Microkinetics simulations
In order to gain insight into the reaction kinetics of CO2RR on the SnO2‒x(OH)4 and Bi-doped SnO2‒x(OH)4 surfaces, microkinetics simulations were carried out based on the DFT energetics of the elementary reaction steps discussed in the previous section. The electrochemical current, the FE, the surface composition in terms of adsorbate coverages and the DRC will be reported as a function of the applied electrochemical potential.We first performed microkinetic simulations of electrochemical CO2RR at a temperature 298 K and a pH of 6.8, close to commonly applied experimental conditions [24]. The rotation speed of the rotating disk electrode (RDE) was set at 100 rpm. Fig. 7(a) shows the total electrochemical current density for the two surface models. The onset potential of ~‒0.5 V vs. RHE in the undoped model is consistent with typical data for Sn-based catalysts [68]. Fig. 7(a) illustrates the potential at approximately ‒0.85 V vs. RHE, at which the total electrochemical current density for the CO2 reduction reaction (CO2RR) in the undoped model reaches a value of approximately 17 mA/ cm2. The data are in reasonable agreement with experiment [24]. Compared to the undoped model, the Bi-doped model exhibits a significantly higher current density at the same voltage in the range of ‒0.2 to ‒0.8 V vs. RHE, resulting in a clearly noticeable improvement in performance. The onset voltage is also lower with a value of approximately ‒0.15 V vs. RHE.
Fig. 7.
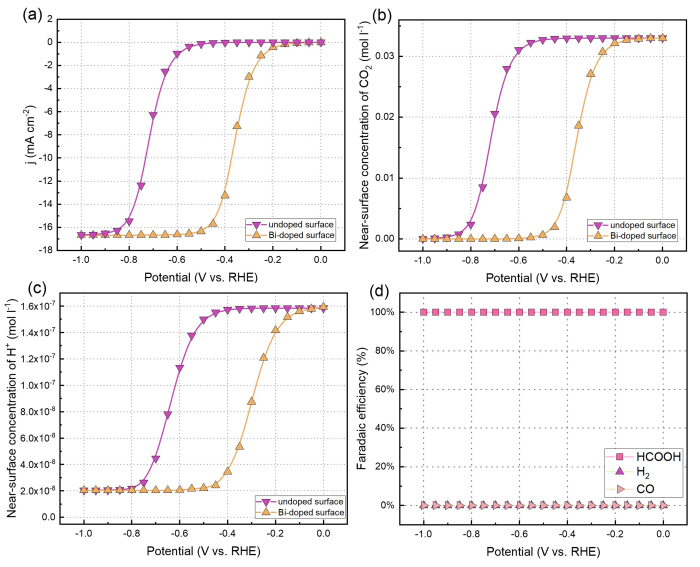
Fig. 7.
Microkinetics simulations of electrochemical CO2RR on undoped and Bi-doped SnO2‒x(OH)4 surfaces using a reaction-diffusion model pertaining to a rotating disc electrode setup operated at 100 r/min with a bulk pH of 6.8. (a) Total electrochemical current; (b) Near-surface concentration of CO2; (c) Near-surface concentration of H+; (d) Faradaic efficiency of various product.
The electrochemical reactions lead to changes in the concentrations of CO2 and H+ near the surface as shown in Figs. 7(b) and 7(c). The proton concentration gradient is very strong and protons are rapidly depleted when CO2 reduction proceeds, leading to a much higher pH at the electrode surface. As we will see below, this will lead to the dominance of reduction of CO2 with water instead of protons. Fig. 7(b) show that at potentials of approximately ‒0.9 and ‒0.6 V vs. RHE, the concentration of CO2 near the surface in the undoped and Bi-doped models is depleted, respectively. At around ‒0.85 V vs. RHE, a plateau is reached due to the near depletion of CO2 at the undoped electrode surface. Then, the current density is completely determined by the diffusion of CO2 through the boundary layer. The impact of such diffusion limitations can also be appreciated from the increasing current density when the RDE rotation speed is increased (Fig. S5). Fig. 7(a) shows the effect of Bi doping on the current density for CO2RR. In the kinetically limited regime, Bi doping has a clear promoting effect on the total electrochemical current density, which is due to the lower overall barrier for HCOOH formation on the Bi-doped SnO2‒x(OH)4 surface. Otherwise, the trends are very similar with respect to the current density as a function of the potential. In terms of selectivity, HCOOH is formed on SnO2‒x(OH)4 at a much higher rate than CO and H2, leading to a HCOOH FE of close to 100% at all potentials (Fig. 7(d)). The product distribution is not influenced by the presence of Bi (Fig. S6(b)).
Figs. 8 and S4(a) show the composition of the surface-adsorbed layer. At low potentials, the surface contains adsorbed CO2 next to some empty sites (the hydroxylated surface state), while the CO2 coverage becomes very low at more negative potential when the reaction becomes limited by CO2 diffusion instead of the reaction kinetics.
Fig. 8.
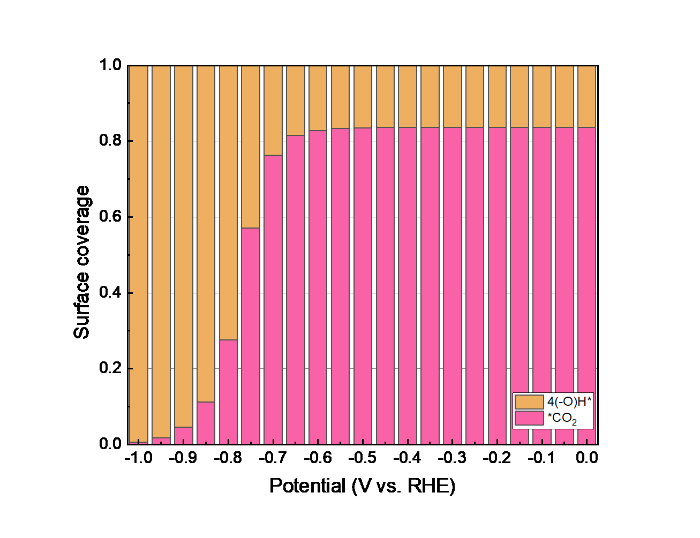
Fig. 8.
Evolution of surface coverages during electrochemical CO2RR on the SnO2‒x(OH)4 surface on a rotating disc electrode at 100 r/min and a bulk pH of 6.8.
To distinguish and better understand the contributions of individual elementary steps involved in the CO2RR as well as to identify which of these steps limit the formation of specific products, we performed a DRC analysis [52]. We carried out this analysis for the undoped and Bi-doped surfaces. From Figs. 9 (undoped surface) and Fig. S7 (doped surface), it follows that formation *COOH with water as a proton source is the rate-determining step for the undoped and Bi-doped electrode. This is reasonable because of the low proton concentration near the surface.
Fig. 9.
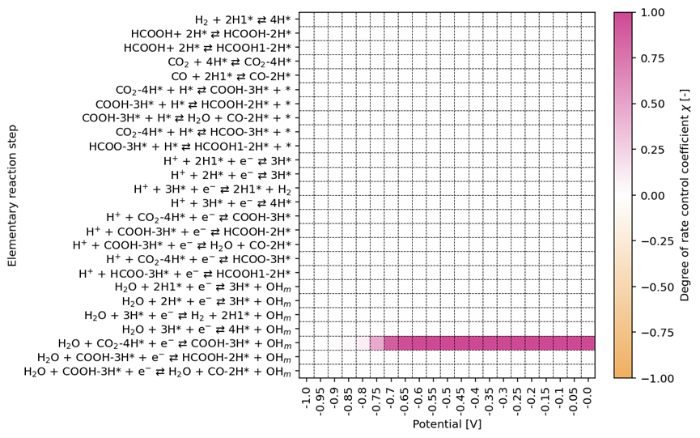
Fig. 9.
The degree of rate control coefficients during electrochemical CO2RR on the SnO2‒x(OH)4 surface on a rotating disc electrode at 100 r/min and a bulk pH of 6.8.
Microkinetics simulations are useful to predict the activity based on a complex reaction mechanism [69⇓⇓-72]. Combined with the DFT-based BEP relationships shown in Fig. 5, a 2-D activity heatmap of the CO2RR rate as a function of the Gibbs free energy change for two descriptors, namely ΔG1 (ΔG*COOH ‒ ΔG*CO2) and ΔG2 (ΔG*HCOOH ‒ ΔG*COOH), can be constructed (Figs. S6‒S11). This heatmap shown in Fig. 10 also includes the position of the dopant metals in the present study. We selected the potential range of -1.0 to 0 V vs. RHE to determine activity trends for CO2RR (Figs. S6‒S11). While the current density correlates with ΔG1 and ΔG2 at a given potential, the adsorption energies corresponding to the maximum activity are almost the same, independent of the potential. We then chose a potential of ‒0.2 V vs. RHE as a potential where the reaction is kinetically limited for all compositions (Fig. S7), to determine the activity behavior (Fig. 10). The maximum activity in Fig. 10 shifts to the region where ΔG1 and ΔG2 are low, representing low barriers for the consecutive hydrogenation steps of CO2. The Bi-doped model exhibits the highest CO2RR rate, followed by Ni, Cu, and Pd, while the activity of the hydroxylated SnO2 surface is relatively close to that of the Bi-doped surface. Fig. 7(a) illustrates that, at a potential of approximately ‒0.2 V vs. RHE, the total electrochemical current density for CO2RR of the Bi-doped catalyst is around 0.4 mA/cm2, which is substantially higher than the value of 0.05 mA/cm2 of the undoped catalyst. Overall, the CO2RR heatmap can help in the design of improved electrocatalysts for this reaction.
Fig. 10.
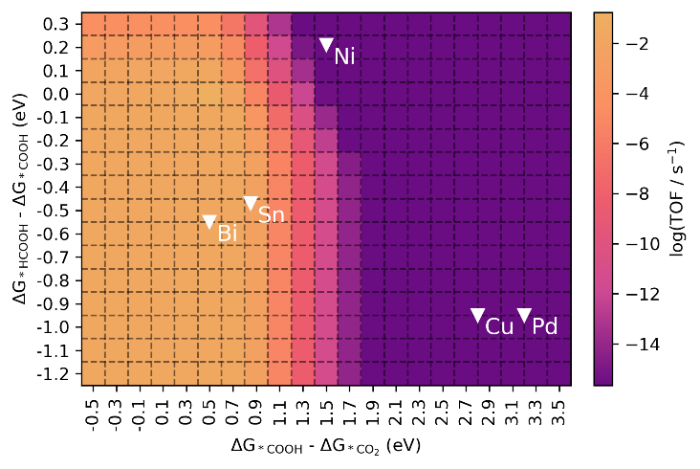
Fig. 10.
Heatmap of the TOF as a function of ΔG*COOH ‒ ΔG*CO2 and ΔG*HCOOH ‒ ΔG*COOH adsorption energies for electrocatalytic CO2RR on metal doped SnO2‒x(OH)4 surface based on DFT-based microkinetic simulations at ‒0.2 V vs. RHE. Reaction conditions are T = 300 K on a rotating disc electrode at 100 r/min and a bulk pH of 6.8.
To properly evaluate the activity differences of the catalysts at various potentials, we analyzed the DRC at two different potentials, namely ‒0.2 V vs. RHE (Fig. S14) and ‒0.8 V vs. RHE (Fig. S15). This analysis shows that COOH formation due to reduction with water and, to some extent, the formation of OH groups at the surface due to reduction with water control the rate for the undoped and Bi-doped catalysts. For the Ni-doped catalyst, COOH formation with protons is the rate-determining step. The low-active dopants Cu and Pd operate in a regime where the HER contributes more to the current density than CO2RR. At a potential of ‒0.8 V vs. RHE, diffusion limitations start controlling the rate for the most active Bi-doped catalyst as shown above. This follows from the sum the DRC values becoming zero, meaning that rate is not limited anymore by the chemical kinetics.
4. Conclusions
We investigated the thermodynamic and kinetic aspects of the elementary steps underlying CO2RR to HCOOH on SnO2 and metal (Ni, Pd, Bi, and Cu) doped SnO2 using DFT calculations combined with microkinetics simulations. Hydroxylation of the SnO2 surface is essential to obtain active SnO2 electrocatalysts with a high CO2RR activity to HCOOH with a negligible contribution of hydrogen evolution, explaining the predicted complete conversion to HCOOH. CO2RR proceeds via carboxyl (COOH*) contrasting earlier literature postulates. BEP relations that link the energetics of the CO2 to *COOH and *COOH to HCOOH steps for metal-doped SnO2 electrodes are established, identifying Bi as the preferred promoter for lowering the barrier of COOH* formation. Additionally, we found that metal dopants with lower adsorption energies of COOH and lower IP can help to reduce the activation barrier. Microkinetics simulations confirm the substantially improved performance upon Bi doping. The results indicate that effective electrocatalysts operate in the regime of low values of ΔG1 and ΔG2, reflecting the reaction energies of the first and second hydrogenation steps, which serve as descriptors for the overall activity. Our findings indicate that metal doping is a promising way to drastically improve the activity of Sn-based electrocatalysts.
Electronic supporting information
Supporting information is available in the online version of this article.
Notes on the selection of electronic properties and catalytic performance for various dopant metals, as well as lists of computed Gibbs free energy profiles, side views of the most stable adsorption configurations, reaction energy diagrams, current density, surface coverages, faradaic efficiency, degree of rate control coefficients, and heatmaps of the TOF for CO2RR (PDF).
Acknowledgment
The authors acknowledge financial support of the China Scholarship Council. The authors acknowledge nederlandse organisatie voor wetenschappelijk onderzoek (NWO) and SURF foundation shared academic resources (SurfSARA) for providing access to computational resources used to carry out the density functional theory calculations reported in this work.
Author Contributions
All authors have given approval to the final version of the manuscript. Zhaochun Liu conceptualization, data curation, formal analysis, investigation, validation, visualization, writing-original draft, writing-review & editing; Xue Zong data curation, discussion; Dionisios G. Vlachos data curation, discussion; Ivo A. W. Filot visualization, writing-review & editing; Emiel J.M. Hensen conceptualization, discussion, writing-review & editing.
Declaration of Interests
The authors declare no competing interests.
Reference

\n Most artificial photosynthesis approaches focus on making hydrogen. Modifying CO\n 2\n, as plants and microbes do, is more chemically complex. Asadi\n et al.\n report that fashioning WSe\n 2\n and related electrochemical catalysts into nanometer-scale flakes greatly improves their activity for the reduction of CO\n 2\n to CO. An ionic liquid reaction medium further enhances efficiency. An artificial leaf with WSe\n 2\n reduced CO\n 2\n on one side while a cobalt catalyst oxidized water on the other side.\n
Ultrathin metal layers can be highly active carbon dioxide electroreduction catalysts, but may also be prone to oxidation. Here we construct a model of graphene confined ultrathin layers of highly reactive metals, taking the synthetic highly reactive tin quantum sheets confined in graphene as an example. The higher electrochemical active area ensures 9 times larger carbon dioxide adsorption capacity relative to bulk tin, while the highly-conductive graphene favours rate-determining electron transfer from carbon dioxide to its radical anion. The lowered tin–tin coordination numbers, revealed by X-ray absorption fine structure spectroscopy, enable tin quantum sheets confined in graphene to efficiently stabilize the carbon dioxide radical anion, verified by 0.13 volts lowered potential of hydroxyl ion adsorption compared with bulk tin. Hence, the tin quantum sheets confined in graphene show enhanced electrocatalytic activity and stability. This work may provide a promising lead for designing efficient and robust catalysts for electrolytic fuel synthesis.
The method of dispersion correction as an add-on to standard Kohn–Sham density functional theory (DFT-D) has been refined regarding higher accuracy, broader range of applicability, and less empiricism. The main new ingredients are atom-pairwise specific dispersion coefficients and cutoff radii that are both computed from first principles. The coefficients for new eighth-order dispersion terms are computed using established recursion relations. System (geometry) dependent information is used for the first time in a DFT-D type approach by employing the new concept of fractional coordination numbers (CN). They are used to interpolate between dispersion coefficients of atoms in different chemical environments. The method only requires adjustment of two global parameters for each density functional, is asymptotically exact for a gas of weakly interacting neutral atoms, and easily allows the computation of atomic forces. Three-body nonadditivity terms are considered. The method has been assessed on standard benchmark sets for inter- and intramolecular noncovalent interactions with a particular emphasis on a consistent description of light and heavy element systems. The mean absolute deviations for the S22 benchmark set of noncovalent interactions for 11 standard density functionals decrease by 15%–40% compared to the previous (already accurate) DFT-D version. Spectacular improvements are found for a tripeptide-folding model and all tested metallic systems. The rectification of the long-range behavior and the use of more accurate C6 coefficients also lead to a much better description of large (infinite) systems as shown for graphene sheets and the adsorption of benzene on an Ag(111) surface. For graphene it is found that the inclusion of three-body terms substantially (by about 10%) weakens the interlayer binding. We propose the revised DFT-D method as a general tool for the computation of the dispersion energy in molecules and solids of any kind with DFT and related (low-cost) electronic structure methods for large systems.
Solid-liquid interfaces are at the heart of many modern-day technologies and provide a challenge to many materials simulation methods. A realistic first-principles computational study of such systems entails the inclusion of solvent effects. In this work, we implement an implicit solvation model that has a firm theoretical foundation into the widely used density-functional code Vienna ab initio Software Package. The implicit solvation model follows the framework of joint density functional theory. We describe the framework, our algorithm and implementation, and benchmarks for small molecular systems. We apply the solvation model to study the surface energies of different facets of semiconducting and metallic nanocrystals and the SN2 reaction pathway. We find that solvation reduces the surface energies of the nanocrystals, especially for the semiconducting ones and increases the energy barrier of the SN2 reaction.
We present a microkinetic model for CO(2) reduction (CO(2)R) on Cu(211) towards C2 products, based on energetics estimated from an explicit solvent model. We show that the differences in both Tafel slopes and pH dependence for C1 vs C2 activity arise from differences in their multi-step mechanisms. We find the depletion in C2 products observed at high overpotential and high pH to arise from the 2nd order dependence of C-C coupling on CO coverage, which decreases due to competition from the C1 pathway. We further demonstrate that CO(2) reduction at a fixed pH yield similar activities, due to the facile kinetics for CO2 reduction to CO on Cu, which suggests C2 products to be favored for CO2R under alkaline conditions. The mechanistic insights of this work elucidate how reaction conditions can lead to significant enhancements in selectivity and activity towards higher value C2 products.
The system carbon dioxide-water is of great scientific and technological importance. Thus, it has been studied often. The literature for the solubility of carbon dioxide in water is vast and interdisciplinary. An exhaustive survey was conducted and approximately 100 experimental investigations were found that reported equilibrium data at pressures below 1 MPa. A model based on Henry’s law was used to correlate the low pressure data (those up to 1 MPa). The following correlation of the Henry’s constants (expressed on a mole fraction basis) was developed ln(H21/MPa)=−6.8346+1.2817×104/T−3.7668×106/T2 +2.997×10⁸/T3 The correlation is valid for 273<T<433 K(0<t<160 °C) where T is in K. Any experimental data that deviated significantly from this model were duly noted.
For most metal-containing CO2 reduction reaction (CO2RR) electrocatalysts, the unavoidable self-reduction to zero-valence metal will promote hydrogen evolution, hence lowering the CO2RR selectivity. Thus it is challenging to design a stable phase with resistance to electrochemical self-reduction as well as high CO2RR activity. Herein, we report a scenario to develop hydrocerussite as a stable and active electrocatalyst via in situ conversion of a complex precursor, tannin-lead(II) (TA-Pb) complex. A comprehensive characterization reveals the in situ transformation of TA-Pb to cerussite (PbCO3), and sequentially to hydrocerussite (Pb3(CO3)2(OH)2), which finally serves as a stable and active phase under CO2RR condition. Both experiments and theoretical calculations confirm the high activity and selectivity over hydrocerussite. This work not only offers a new approach of enhancing the selectivity in CO2RR by suppressing the self-reduction of electrode materials, but also provides a strategy for studying the reaction mechanism and active phases of electrocatalysts.
Electrochemical reduction of CO2 to fuels and chemical feedstocks using renewable electricity provides a promising approach toward artificial carbon recycling to address the global challenges in energy and sustainability. The most crucial step for this technique is to develop efficient electrocatalysts capable of reducing CO2 to valuable hydrocarbon products at a low overpotential with high selectivity and stability. In this article, we present a review on the recent developments and understanding of p-block post-transition metal (e.g., Sn, In, Pb, and Bi) based electrocatalysts for electrochemical CO2 reduction. This group of electrocatalysts shows particularly high selectivity for reduction of CO2 to formate or formic acid. Our main focus will be on the fundamental understanding of surface chemistry, active sites, reaction mechanism, and structure–activity relationships. Strategies to enhance the activity including morphology control, nanostructuring, defect engineering, doping, and alloying to modulate the electronic structure will also be briefly discussed. Finally, we summarize the existing challenges and present perspectives for the future development of this exciting field.
Recent advances in the understanding of reactivity trends for chemistry at transition-metal surfaces have enabled in silico design of heterogeneous catalysts in a few cases. The current status of the field is discussed with an emphasis on the role of coupling theory and experiment and future challenges.
