
催化学报 ›› 2026, Vol. 91: 1-49.DOI: 10.1016/S1872-2067(26)65230-8
• 综述 • 下一篇
万杨a, 邹报a, 宋相海a, 刘燕a,*( ), 罗建民b, 刘鑫a, 李鑫c,*(), 霍鹏伟a,*()
收稿日期:2026-04-25
接受日期:2026-06-22
出版日期:2026-12-18
发布日期:2026-10-13
通讯作者:
*电子信箱: huopw@ujs.edu.cn (霍鹏伟),基金资助:
Yang Wana, Bao Zoua, Xianghai Songa, Yan Liua,*(), Jianmin Luob, Xin Liua, Xin Lic,*(), Pengwei Huoa,*()
Received:2026-04-25
Accepted:2026-06-22
Online:2026-12-18
Published:2026-10-13
About author:Yan Liu received her B.A. degree from Nanjing Normal University in 2003, and Ph.D degree from Jiangsu University in 2011. From 2018-2019, she worked as a visiting scholar at the University of California, Irvine (USA). Her research interests currently focus on design of functional materials and their applications in engineering and catalysis. She has published more than 60 peer-reviewed papers.Yang Wan: Writing - review & editing, Writing - original draft, Data curation, Conceptualization; Bao Zou, Xianghai Song, and Xin Liu: Data curation, Software, Formal analysis; Jianmin Luo: Project administration, Validation, Supervision; Yan Liu, and Xin Li: Project administration, Methodology, Review & editing; Pengwei Huo: Project administration, Methodology, Investigation, Funding acquisition.
Supported by:摘要:
塑料制品因具备轻便耐用、成本低廉等特性, 其全球年产量已高达数亿吨. 然而, 大量塑料制品在短暂使用后便被丢弃, 其在自然环境中极难降解, 既加剧了“白色污染”对土壤、水体与生态系统的长期损害, 也导致了大量碳氢资源的浪费、流失. 面对资源与环境的双重压力, 循环经济理念与“双碳”目标的兴起, 指引塑料废弃物的处理方式从末端处理转向资源化高值利用. 近些年来, 催化转化技术成为破解塑料污染—资源化利用矛盾的关键方法, 包含但不限于光催化、热催化、电催化及生物催化等方式. 催化转化技术的应用, 不仅能直接有效地减少环境污染, 还可以以废弃资源为原料生产高价值化学品、燃料等, 有效缓解世界能源短缺问题.
本文系统地介绍了催化转化技术在塑料废弃物处理中的最新进展. 首先介绍了塑料升级转化的两条路径(即直接路径与间接路径)以及塑料升级转化领域存在的重难点. 其中, 直接路径指通过催化裂解、水解或氧化等方式, 将塑料大分子一步转化为单体、小分子化学品或燃料; 间接路径则是指将塑料先转化为平台小分子, 再经二次反应(如氧化、氢化、胺化等)制备高附加值产物. 其次, 针对光催化、热催化、电催化及生物催化等不同催化方式, 概括性地介绍了各自的作用机理, 并重点归纳了催化剂的设计策略, 涵盖异质结工程、缺陷工程、贵金属助催化剂体系、元素掺杂工程及微生物基因编辑改造手段等前沿手段, 同时对各催化方法的优势与局限性进行了对比分析. 在此基础上, 本文按产物类型与转化机制不同, 系统梳理了各类催化技术的最新研究进展, 产物体系覆盖C1气体、有机酸、醇类、芳烃、燃料及功能碳材料等多种高价值产品. 值得关注的是, 光热协同、光电协同及生物-化学级联等复合催化体系展现出显著的“1+1>2”协同增效作用, 在降低反应能耗、提升目标产物选择性以及处理复杂混合塑料方面优势突出, 为废塑料的高效资源化提供了新的技术方向. 最后, 对未来催化转化废塑料的重点研究方向与潜在方法进行了前瞻性展望, 提出应着力于开发低成本、抗中毒、长寿命的新型催化剂及高效反应器, 结合原位表征与理论计算深入研究反应机理与路径, 建立多催化方式协同的绿色低能耗反应体系, 推动塑料与其他废弃物(如生物质、CO2、硝酸盐等)的协同转化, 并通过生命周期评价与技术经济分析评估技术的环境效益与经济可行性.
综上, 本文系统梳理了多种催化技术在塑料升级中的反应机制、催化剂设计与产物选择性规律, 对比了多种催化技术的应用进展与现存挑战. 未来应聚焦低成本抗中毒催化剂、多场耦合体系、原位机理与生命周期评估, 加速工业化, 助力循环经济与碳中和目标.
万杨, 邹报, 宋相海, 刘燕, 罗建民, 刘鑫, 李鑫, 霍鹏伟. 塑料废弃物催化升级转化技术研究进展[J]. 催化学报, 2026, 91: 1-49.
Yang Wan, Bao Zou, Xianghai Song, Yan Liu, Jianmin Luo, Xin Liu, Xin Li, Pengwei Huo. Recent advances in catalytic conversion technologies for plastic waste upgrading[J]. Chinese Journal of Catalysis, 2026, 91: 1-49.
| Type of treatment | Advantages | Disadvantages | Applicable scenarios |
|---|---|---|---|
| Incineration | significantly reduces landfill space; recovers thermal energy | produces toxic gases; high carbon emissions; generates ash residue | mixed non-recyclable plastics with high calorific value |
| Landfill | simple operation; low cost | occupies large land area; pollutes groundwater and soil | contaminated plastics that cannot be recycled |
| Mechanical recycling | Simple process and low cost; direct reuse of plastics | decreased mechanical properties; high requirement for raw material purity | clean, single-polymer plastics (e.g., PET bottles, HDPE containers) |
| Photocatalysis | ambient temperature and pressure; green, low energy consumption | long reaction time; low reaction stability; plastics need to be pretreated | thin plastic films or small molecules after pretreatment |
| Thermal catalysis | high conversion rate and stability; technological maturity; handle complex plastics | prone to coking and deactivation; release toxic gases; Relies on noble metals/hydrogen | large-scale continuous processing of mixed plastics; high-value products |
| Electrocatalysis | controllable reaction pathways; can use green electricity | electrodes prone to corrosion; plastics must be pretreated | directed synthesis of high-value chemicals (e.g., small-molecule acids, esters) |
| Photothermalcatalysis | high energy utilization efficiency; mild conditions | requires high-intensity light source; poor catalyst stability; difficult product purity control | selective conversion of recalcitrant plastics (e.g., PVC) |
| Photoelectrocatalysis | synergy of light and electricity; high efficiency; can produce H2 | complex system design (requires semiconductor electrodes); difficult to scale up | small-scale production of specialty chemicals |
| Biocatalysis | mild conditions; high selectivity; strong substrate specificity | enzymes easily inactivated; long cycle time; narrow application range | degradable plastics; mixed plastics; conversion under extreme environments (e.g., marine, soil) |
Table 1 Existing plastic treatment technologies.
| Type of treatment | Advantages | Disadvantages | Applicable scenarios |
|---|---|---|---|
| Incineration | significantly reduces landfill space; recovers thermal energy | produces toxic gases; high carbon emissions; generates ash residue | mixed non-recyclable plastics with high calorific value |
| Landfill | simple operation; low cost | occupies large land area; pollutes groundwater and soil | contaminated plastics that cannot be recycled |
| Mechanical recycling | Simple process and low cost; direct reuse of plastics | decreased mechanical properties; high requirement for raw material purity | clean, single-polymer plastics (e.g., PET bottles, HDPE containers) |
| Photocatalysis | ambient temperature and pressure; green, low energy consumption | long reaction time; low reaction stability; plastics need to be pretreated | thin plastic films or small molecules after pretreatment |
| Thermal catalysis | high conversion rate and stability; technological maturity; handle complex plastics | prone to coking and deactivation; release toxic gases; Relies on noble metals/hydrogen | large-scale continuous processing of mixed plastics; high-value products |
| Electrocatalysis | controllable reaction pathways; can use green electricity | electrodes prone to corrosion; plastics must be pretreated | directed synthesis of high-value chemicals (e.g., small-molecule acids, esters) |
| Photothermalcatalysis | high energy utilization efficiency; mild conditions | requires high-intensity light source; poor catalyst stability; difficult product purity control | selective conversion of recalcitrant plastics (e.g., PVC) |
| Photoelectrocatalysis | synergy of light and electricity; high efficiency; can produce H2 | complex system design (requires semiconductor electrodes); difficult to scale up | small-scale production of specialty chemicals |
| Biocatalysis | mild conditions; high selectivity; strong substrate specificity | enzymes easily inactivated; long cycle time; narrow application range | degradable plastics; mixed plastics; conversion under extreme environments (e.g., marine, soil) |
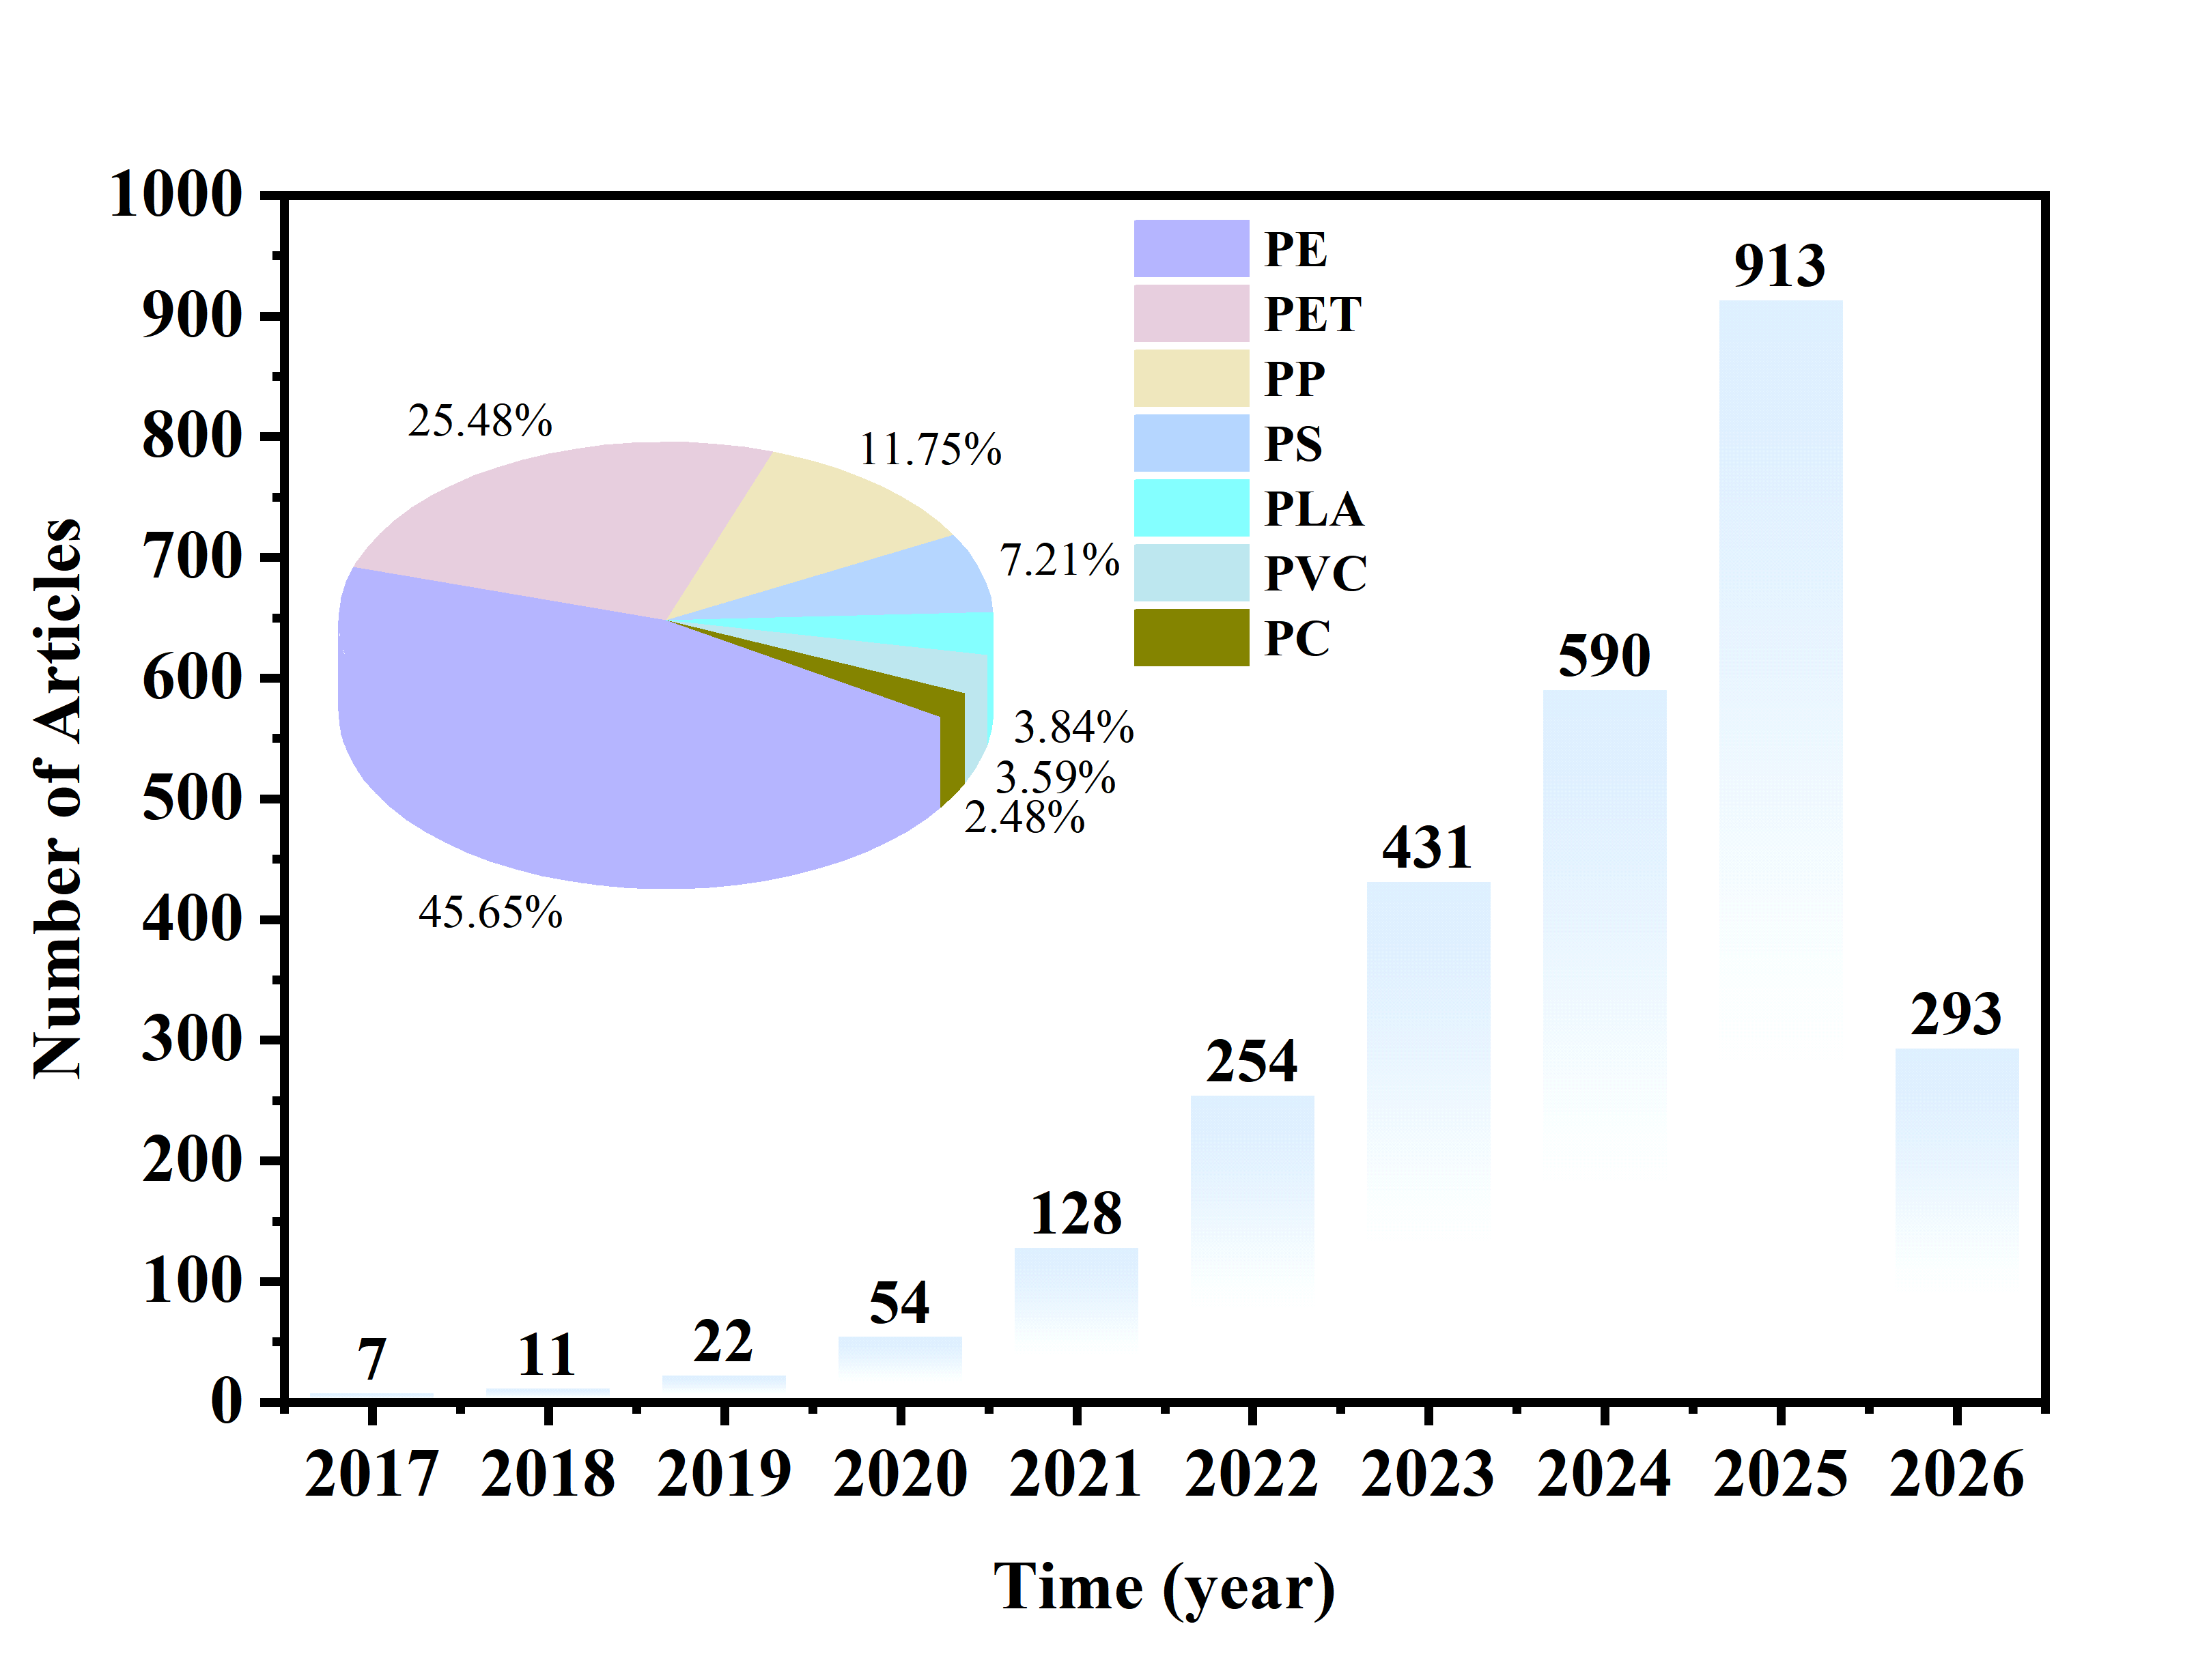
Fig. 1. Proportion of various plastics in upcycling conversion and the number of articles on plastic upcycling published between 2017 and 2026, based on a Web of Science search using the keywords: “upcycling” and “plastic” (conducted on April 30, 2026).
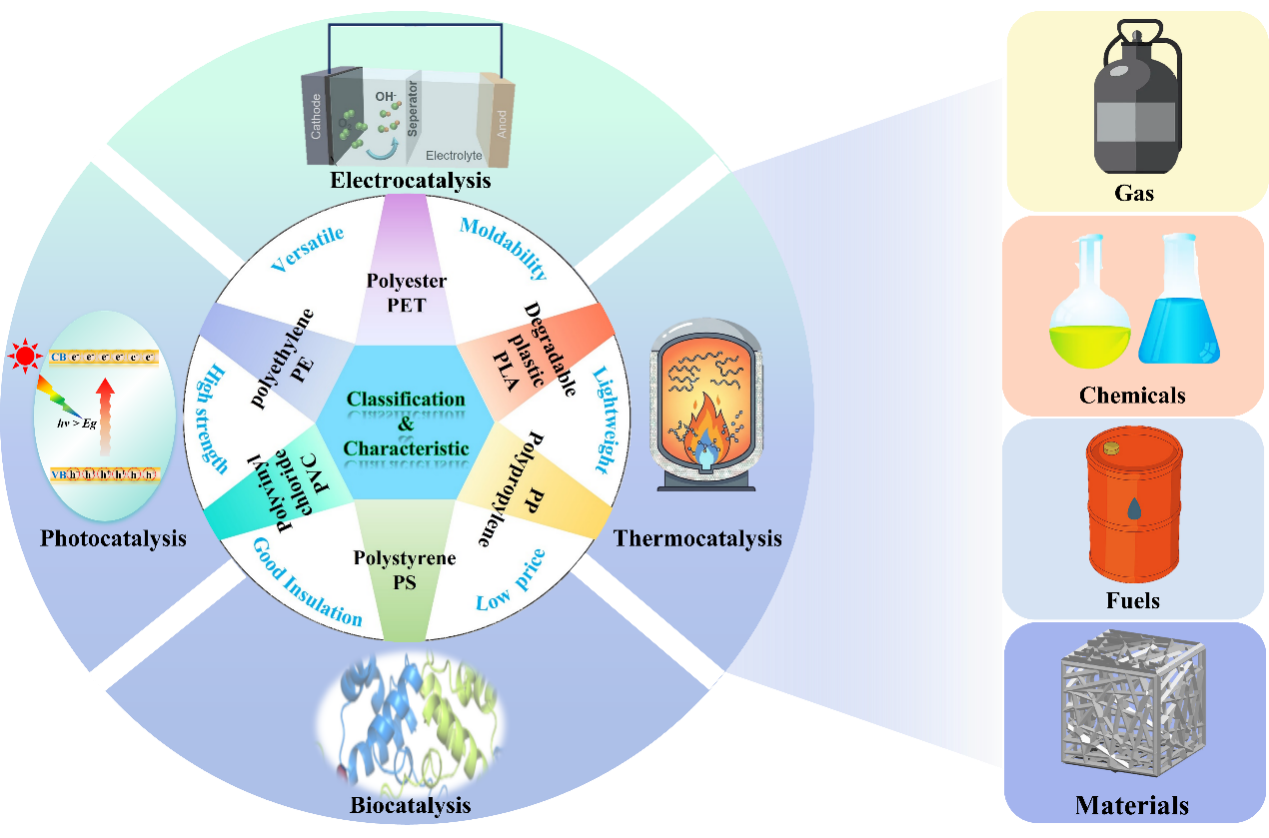
Fig. 2. Plastic classification, advantages, catalytic upcycling ways, and value-added products.

Fig. 3. Schematic diagram of direct and indirect pathways for plastic upcycling.
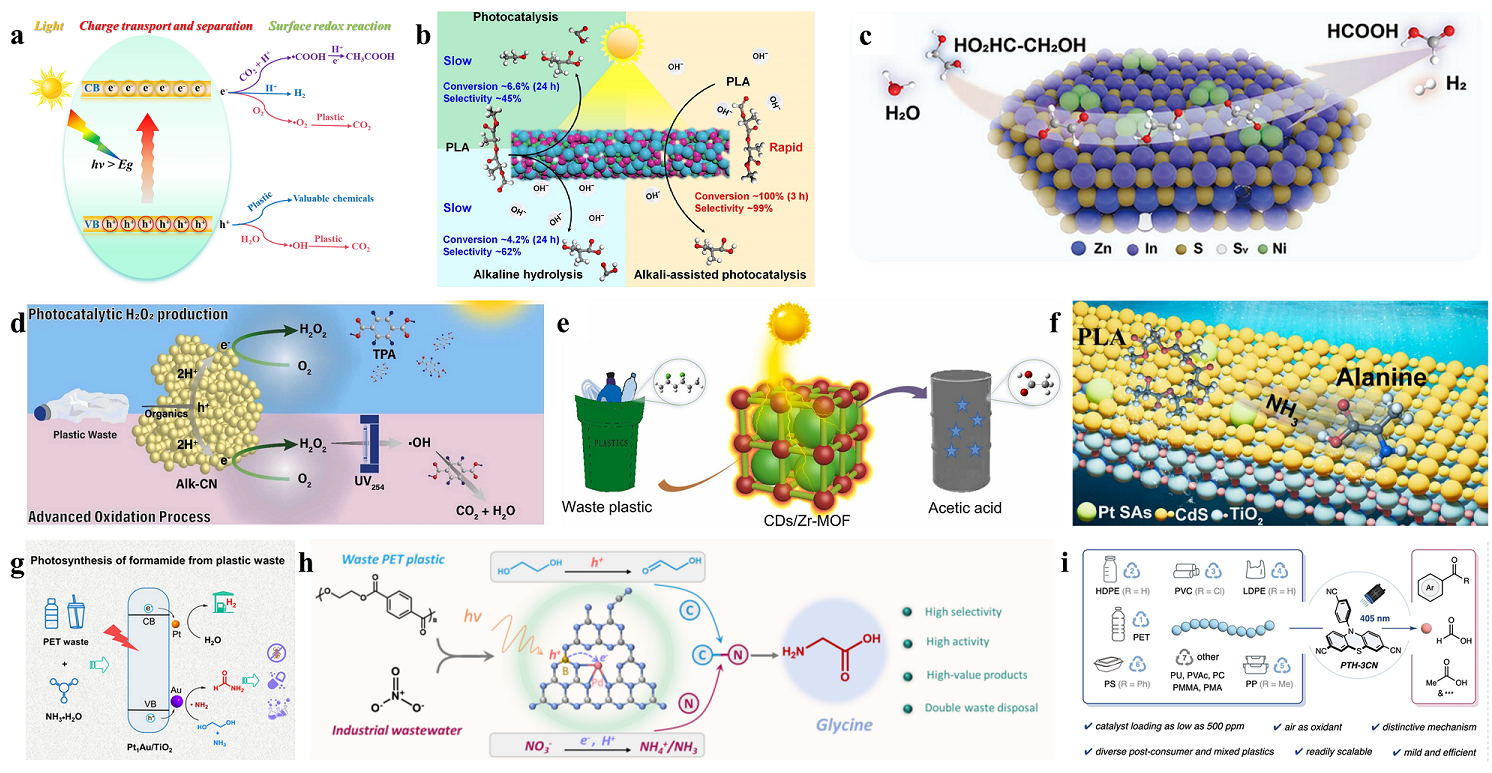
Fig. 4. (a) Schematic diagram of the photocatalytic conversion mechanism in plastics. (b) Photocatalytic conversion of PLA plastics over ZnInFe-MMMO. Reprinted with permission from Ref. [42]. Copyright 2024, John Wiley and Sons. (c) Photocatalytic conversion of PLA plastics on CdS-H@1NiS-0.5PdS. Reprinted with permission from Ref. [43]. Copyright 2025, Elsevier. (d) Schematic diagram of the complete mineralization of PET waste by g-C3N4 catalyst under photocatalytic conditions. Reprinted with permission from Ref. [44]. Copyright 2025, Elsevier. (e) Schematic diagram of photocatalytic conversion of PVC plastic on CDs/Zr-MOF. Reprinted with permission from Ref. [45]. Copyright 2023, Elsevier. (f) Schematic diagram of Pt single-atom photocatalyst converting PLA into alanine. Reprinted with permission from Ref. [46]. Copyright 2025, American Chemical Society. (g) Schematic diagram of the Pt1Au/TiO2 photocatalyst converting PET to FA. Reprinted with permission from Ref. [47]. Copyright 2025, John Wiley and Sons. (h) Schematic diagram of the Pd-B dual-atom photocatalyst converting PET and NO3- into glycine. Reprinted with permission from Ref. [48]. Copyright 2026, Springer Nature. (i) Schematic diagram of the organic catalyst PTH-3CN of benzothiazine derivatives performing photocatalytic upgrading of plastics. Reprinted with permission from Ref. [49]. Copyright 2026, Springer Nature.
| Catalyst | Plastic | Conditions | Products | Ref. |
|---|---|---|---|---|
| TiO2 | PP | pH=3, 50 h, and sunlight irradiation | CO2 | [ |
| CdS QDs | PET | 8 h, Xe lamp irradiation | formate, acetate, and H2 | [ |
| CoS/CeO2 | PET | 6 h, Xe lamp irradiation | CO2, CO, CH4 | [ |
| ZnInFe-MMO | PLA | 0.5 mol L-1 NaOH solution, 3 h, and Xe lamp irradiation | sodium lactate | [ |
| S-BiVO4/In2S3 | PLA | 5 h, Xe lamp (λ ≥ 420 nm) irradiation | acetic acid | [ |
| d-NiPS3/CdS | PLA and PET | 9 h, full-spectrum irradiation | H2, organic acid | [ |
| Alk-CN | PLA and PET | 7 d, UV254 irradiation | TPA, H2O2 | [ |
| CDs/Zr-MOF | PVC | 60 h, light illumination | acetic acid | [ |
| Pt SAs-CTA | PLA | NH3·H2O, Xe lamp (λ > 420 nm) | alanine | [ |
| Diatomic Pd-B | PET | 24 h, Xe lamp (320 nm < λ < 780 nm) | glycine | [ |
| PTH-3CN | PS, PE, PP, and PVC | 405 nm LED illumination | benzoic acid, formic acid, and acetic acid | [ |
Table 2 Photocatalytic conversion of plastics over different catalysts.
| Catalyst | Plastic | Conditions | Products | Ref. |
|---|---|---|---|---|
| TiO2 | PP | pH=3, 50 h, and sunlight irradiation | CO2 | [ |
| CdS QDs | PET | 8 h, Xe lamp irradiation | formate, acetate, and H2 | [ |
| CoS/CeO2 | PET | 6 h, Xe lamp irradiation | CO2, CO, CH4 | [ |
| ZnInFe-MMO | PLA | 0.5 mol L-1 NaOH solution, 3 h, and Xe lamp irradiation | sodium lactate | [ |
| S-BiVO4/In2S3 | PLA | 5 h, Xe lamp (λ ≥ 420 nm) irradiation | acetic acid | [ |
| d-NiPS3/CdS | PLA and PET | 9 h, full-spectrum irradiation | H2, organic acid | [ |
| Alk-CN | PLA and PET | 7 d, UV254 irradiation | TPA, H2O2 | [ |
| CDs/Zr-MOF | PVC | 60 h, light illumination | acetic acid | [ |
| Pt SAs-CTA | PLA | NH3·H2O, Xe lamp (λ > 420 nm) | alanine | [ |
| Diatomic Pd-B | PET | 24 h, Xe lamp (320 nm < λ < 780 nm) | glycine | [ |
| PTH-3CN | PS, PE, PP, and PVC | 405 nm LED illumination | benzoic acid, formic acid, and acetic acid | [ |
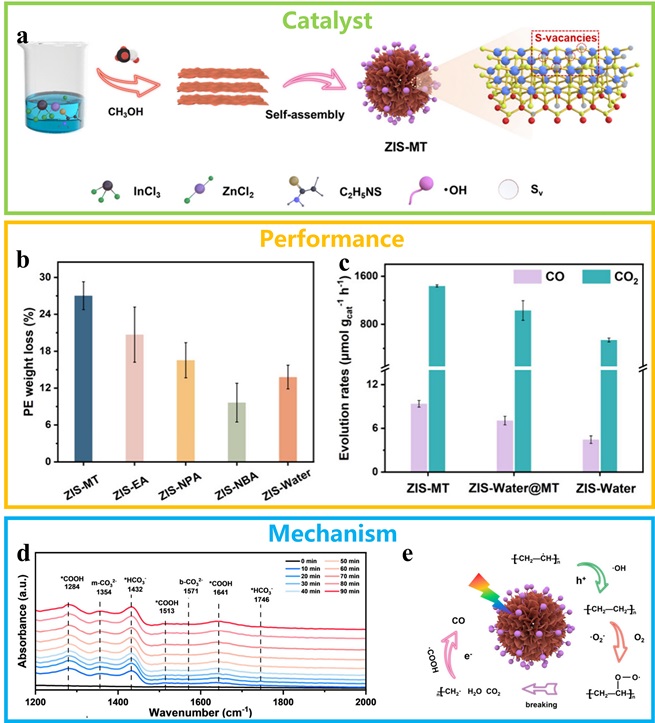
Fig. 5. (a) Schematic diagram of the preparation process for the ZIS-MT catalyst. (b) The effect of different catalysts on the weight loss of PE plastic. (c) Graph of gas yield from degradation. (d) In-situ infrared images of the degradation process. (e) Diagram of the degradation mechanism. Reprinted with permission from Ref. [97]. Copyright 2025, American Chemical Society.
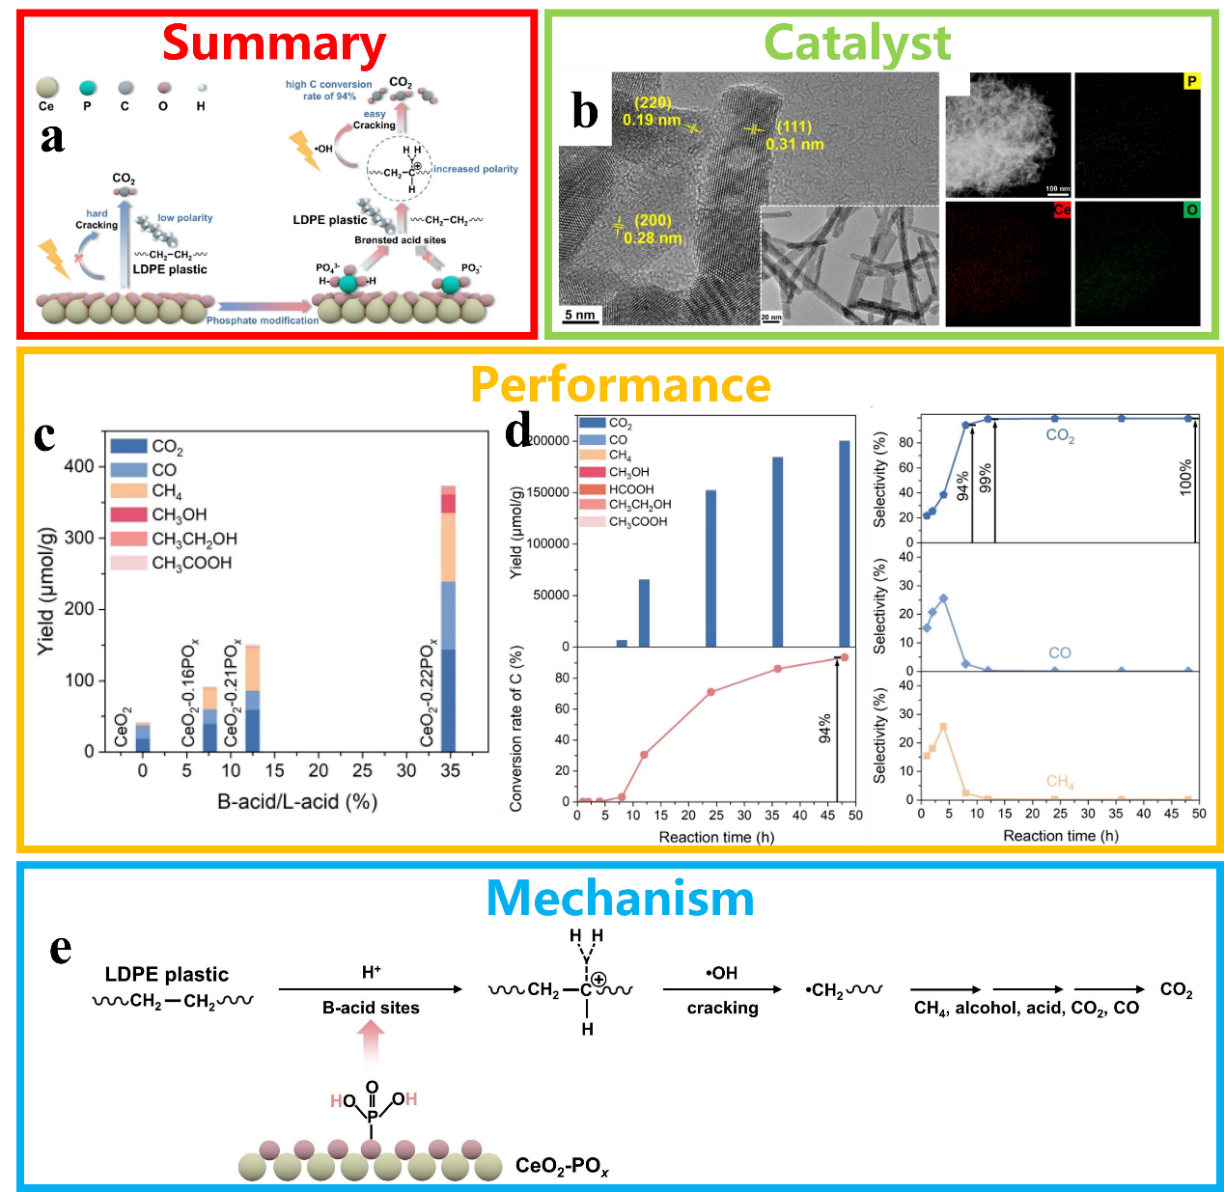
Fig. 6. (a) Schematic diagram illustrating the conversion of PE plastic into C1. (b) TEM, HRTEM and EDS elemental mapping images of CeO2-nPOχ. (c) The yield of LDPE photodegradation for different CeO2-based photocatalysts, and the effect of the B-acid to L-acid ratio on the yield. (d) Diagram showing the variation in product selectivity for CO2, CO and CH4 over time. (e) Reaction pathways for the photocatalytic conversion of PE plastic into C1 products. Reprinted with permission from Ref. [98]. Copyright 2024, Elsevier.
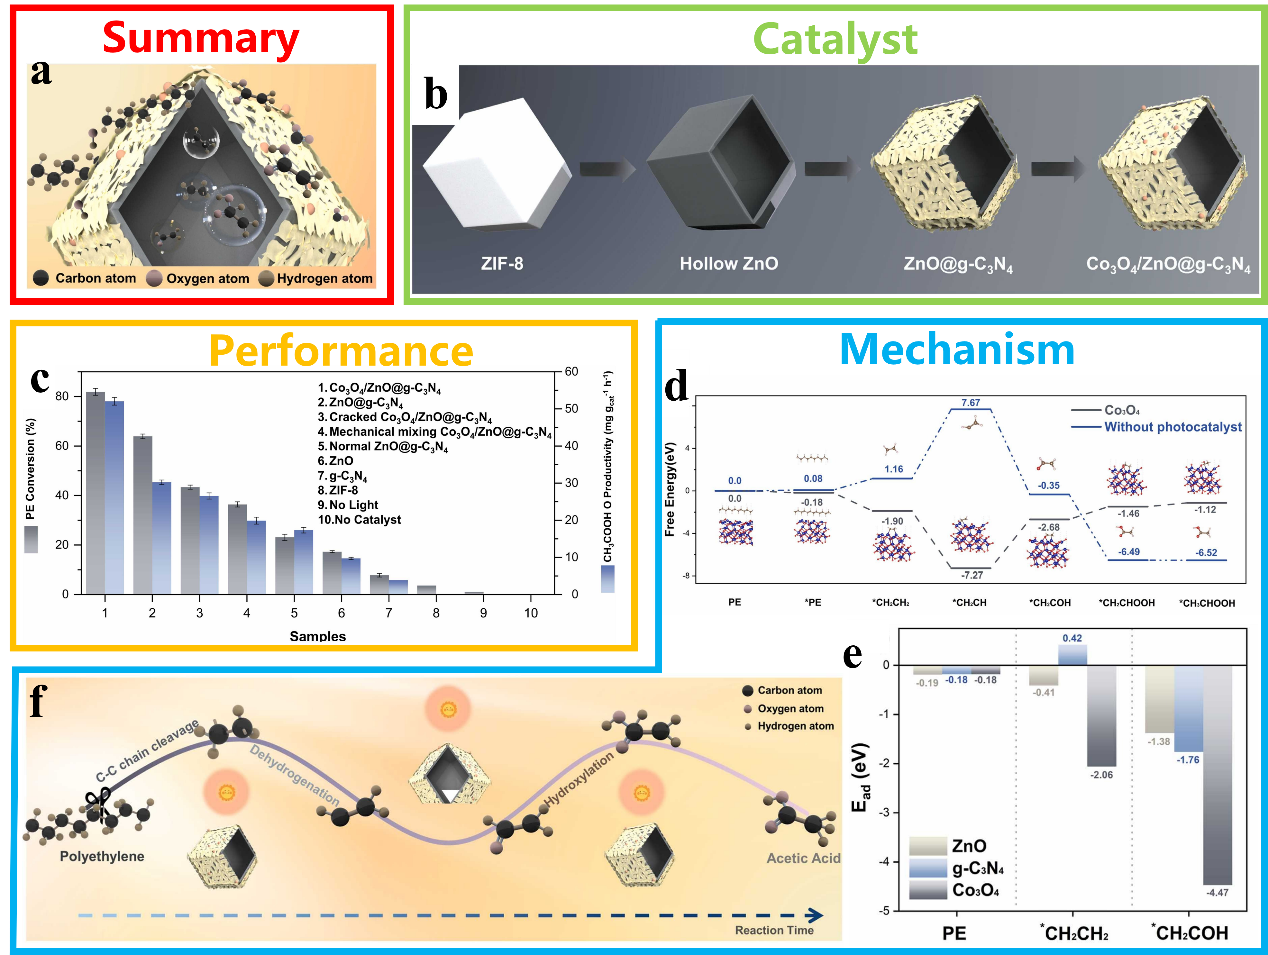
Fig. 7. (a) Schematic illustration of the series-parallel structured catalyst (Co3O4/ZnO@g-C3N4) for the cleavage of C-C bonds in plastics. (b) The synthesis of Co3O4/ZnO@g-C3N4 material. (c) The ability of the as-synthesized photocatalysts to upgrade PE to AcOH under photocatalytic conditions; d: Calculated free energy changes for each step in the photocatalytic upgrading of PE catalyzed by Co3O4/ZnO@g-C3N4. (e) The binding energies of PE and key reaction intermediates at the ZnO, g-C3N4, and Co3O4 sites on the Co3O4/ZnO@g-C3N4 surface. (f) Mechanism of the PE photocatalytic valorization into AcOH over Co3O4/ZnO@g-C3N4. Reprinted with permission from Ref. [102]. Copyright 2025, Elsevier.
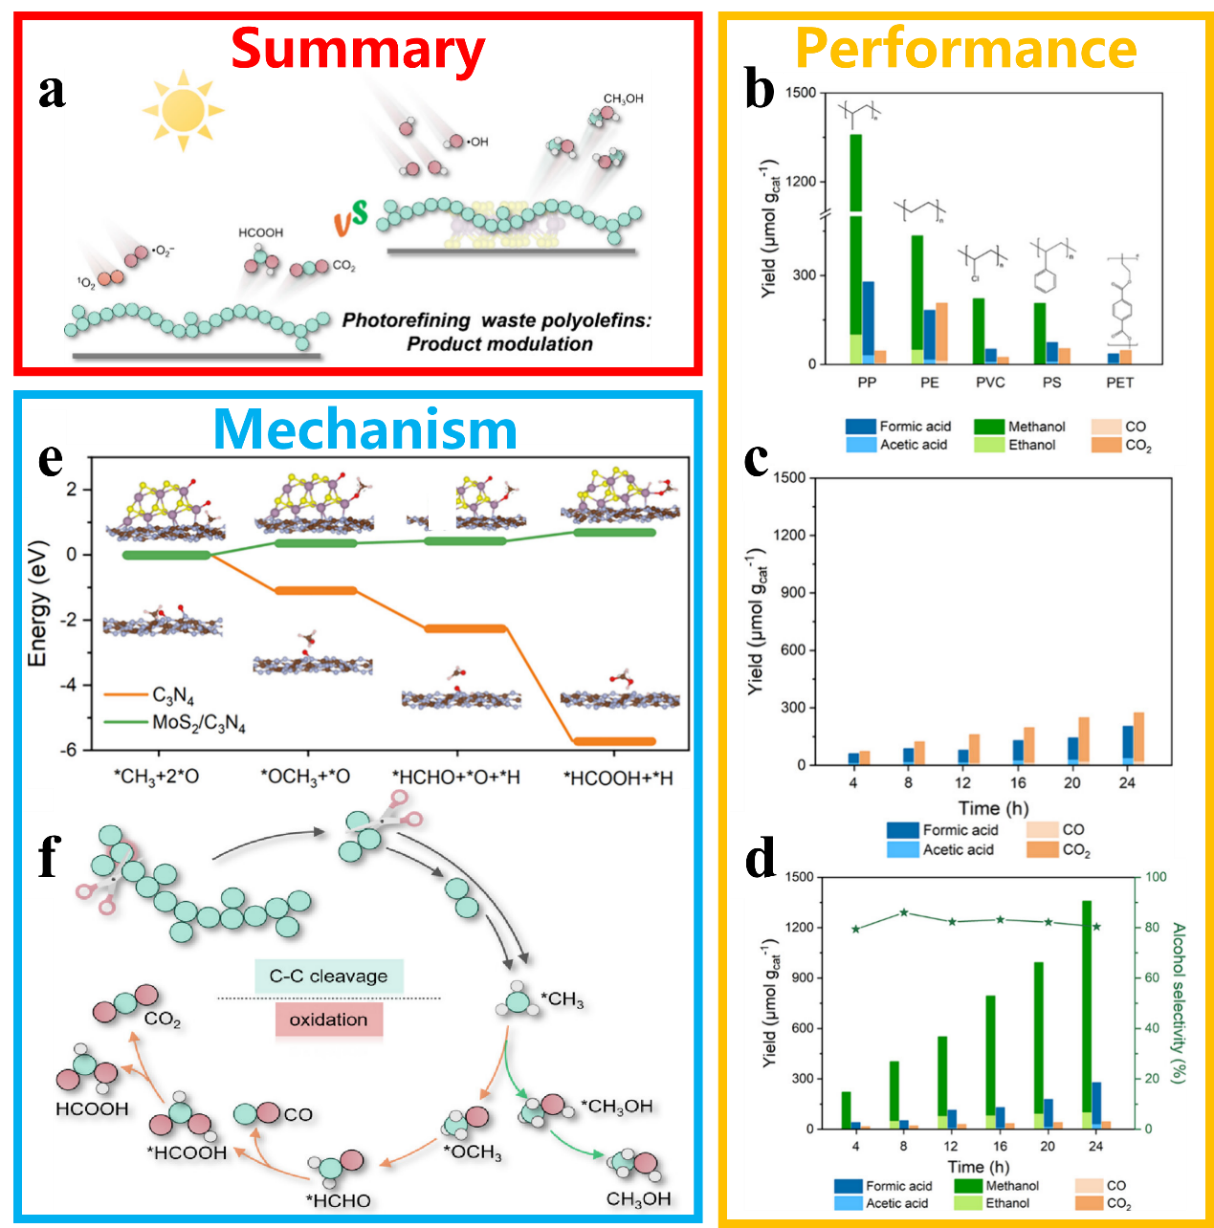
Fig. 8. (a) Scheme for product control in the photocatalytic conversion of waste polyolefins. (b) Photocatalytic conversion performance of different plastics on MoS2/C3N4. The change in product over time on C3N4 (c) and MoS2/C3N4 (d). (e) The calculated reaction pathways and free energy diagrams for the generation of HCOOH on different catalysts. (f) Possible mechanisms for the transformation of plastics into different products. Reprinted with permission from Ref. [103]. Copyright 2025, American Chemical Society.
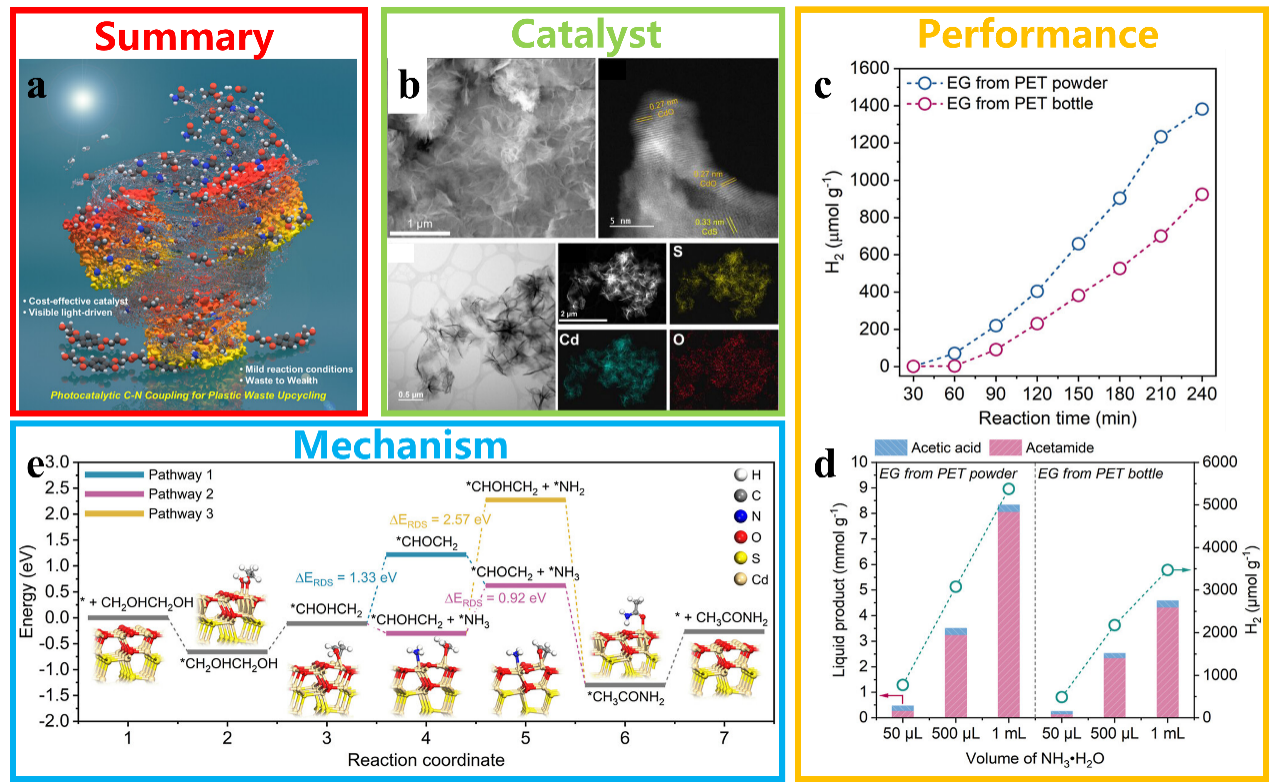
Fig. 9. (a) Scheme for the upgraded utilisation of plastic waste using photocatalytic C-N coupling technology. (b) Morphology of CdS catalysts as observed by SEM, TEM and HRTEM, and EDS elemental mapping. (c) The yield of H2 in the photocatalytic coupling reaction of PET-derived EG with an ammonia solution. (d) The effect of varying volumes of NH3·H2O on the liquid products and H2 yield in a photocatalytic C-N coupling system. Reprinted with permission from Ref. [104]. Copyright 2025, American Chemical Society. (e) Free-energy diagram of the key reaction pathways and corresponding intermediates for the C-N coupling reaction on CdS.

Fig. 10. (a) The process and products of thermocatalytic conversion of plastics. Reprinted with permission from Ref. [134]. Copyright 2020, AAAS. (b) Conversion of HDPE using ZSM-5 zeolites with different Si/Al ratios. Reprinted with permission from Ref. [135]. Copyright 2025, American Chemical Society. (c) Schematic diagram of the conversion of PE plastic using M720 zeolite catalyst. Reprinted with permission from Ref. [136]. Copyright 2024, Royal Society of Chemistry. (d) Schematic diagram of the use of FeCoAl-LDO catalysts for the thermocatalytic conversion of PS to a product rich in monocyclic aromatics. Reprinted with permission from Ref. [137]. Copyright 2025, Elsevier. (e) Schematic diagram of PE recycling over Pt/SrTiO3. Reprinted with permission from Ref. [138]. Copyright 2019, American Chemical Society. (f) Schematic diagram of the conversion of PE plastic into aromatic compounds on a Pt/Al2O3 catalyst. Reprinted with permission from Ref. [139]. Copyright 2020, AAAS.
| Catalyst | Plastic | Conditions | Products | Ref. |
|---|---|---|---|---|
| ZSM-5 | HDPE | 450 °C | gas and oil | [ |
| FeCoAl-LDO | PS | 500 °C | C7-C12 light aromatics | [ |
| SrTiO3 | PE | 300 °C, 170 psi H2 | liquid products | [ |
| Pt/γ-Al2O3 | PE | 280 °C | long-chain alkyl aromatics | [ |
| Ru/Nb2O5 | PET, PS, PC | 200-320 °C, H2 | aromatic monomers | [ |
| MCM-41 and HZSM-5 | mixed packaging plastics | 500 and 550 °C | BTEX | [ |
| UiO-66 | PE | 400 °C | liquid and gaseous hydrocarbons | [ |
| Single-atom Ni/WO2.72 | PE | 240-260 °C and 3 MPa H2 | C5-20 liquid fuels | [ |
| RuLa-DA | PC | 550 °C (hydropyrolysis) and 200 °C, 0.25 MPa H2 (hydrogenation) | cyclohexanol | [ |
Table 3 Thermocatalytic conversion of plastics over different catalysts.
| Catalyst | Plastic | Conditions | Products | Ref. |
|---|---|---|---|---|
| ZSM-5 | HDPE | 450 °C | gas and oil | [ |
| FeCoAl-LDO | PS | 500 °C | C7-C12 light aromatics | [ |
| SrTiO3 | PE | 300 °C, 170 psi H2 | liquid products | [ |
| Pt/γ-Al2O3 | PE | 280 °C | long-chain alkyl aromatics | [ |
| Ru/Nb2O5 | PET, PS, PC | 200-320 °C, H2 | aromatic monomers | [ |
| MCM-41 and HZSM-5 | mixed packaging plastics | 500 and 550 °C | BTEX | [ |
| UiO-66 | PE | 400 °C | liquid and gaseous hydrocarbons | [ |
| Single-atom Ni/WO2.72 | PE | 240-260 °C and 3 MPa H2 | C5-20 liquid fuels | [ |
| RuLa-DA | PC | 550 °C (hydropyrolysis) and 200 °C, 0.25 MPa H2 (hydrogenation) | cyclohexanol | [ |

Fig. 11. (a) Schematic illustration of the selective cleavage of C-O/C-C bonds in plastics by Ru-based catalysts to form aromatic compounds. Reprinted with permission from Ref. [151]. Copyright 2020, John Wiley and Sons. (b) Schematic diagram of the conversion of mixed plastics into BETX using a tandem catalyst. Reprinted with permission from Ref. [152]. Copyright 2023, Elsevier. (c) Schematic diagram of plastic conversion into useful hydrocarbons using the UiO-66 catalyst. Reprinted with permission from Ref. [153]. Copyright 2024, John Wiley and Sons. (d) Schematic diagram of plastic to fuel conversion over WOX-supported single-atom Ni catalyst. Reprinted with permission from Ref. [154]. Copyright 2025, American Chemical Society. (e) Schematic diagram of plastic to EG and p-xylene (PX) conversion over Cu/UiO-66-NH2-A catalyst. Reprinted with permission from Ref. [155]. Copyright 2025, John Wiley and Sons. (f) Schematic diagram of conversion of PC plastic to cyclohexanol over RuLa dual-atom catalyst. Reprinted with permission from Ref. [156]. Copyright 2025, John Wiley and Sons.
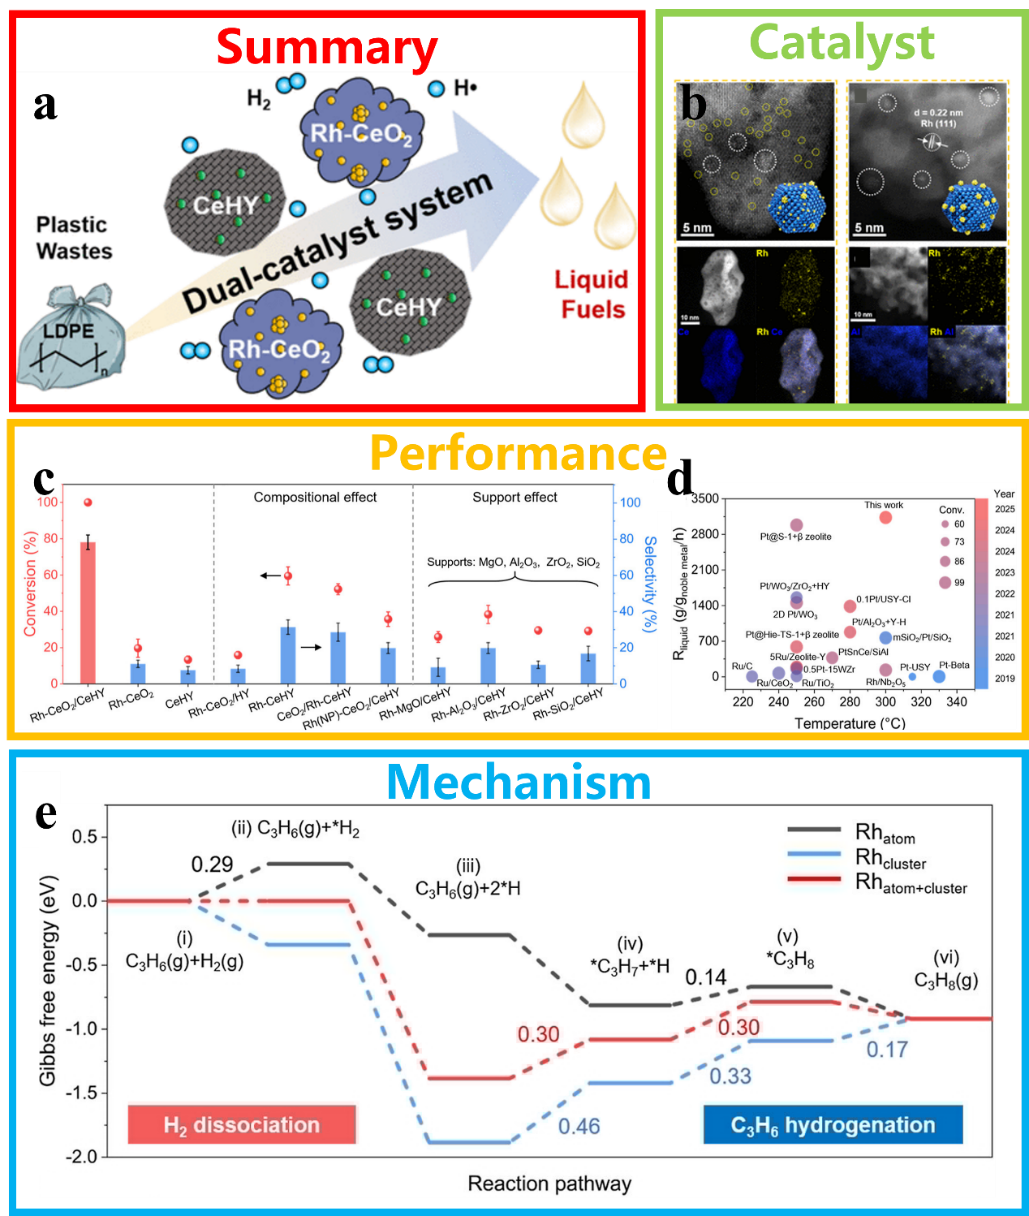
Fig. 12. (a) Schematic diagram of the hydrocracking of LDPE into liquid fuels using a CeHY+Rh-CeO2 catalyst. (b) HAADF-STEM and EDX mapping images of Rh-CeO2 and Rh-Al2O3. (c) Performance of different catalysts in the conversion of LDPE plastic. (d) Comparison of this work with other works. (e) Gibbs free energy profiles of the reaction pathways on different catalyst models. Reprinted with permission from Ref. [166]. Copyright 2025, American Chemical Society.
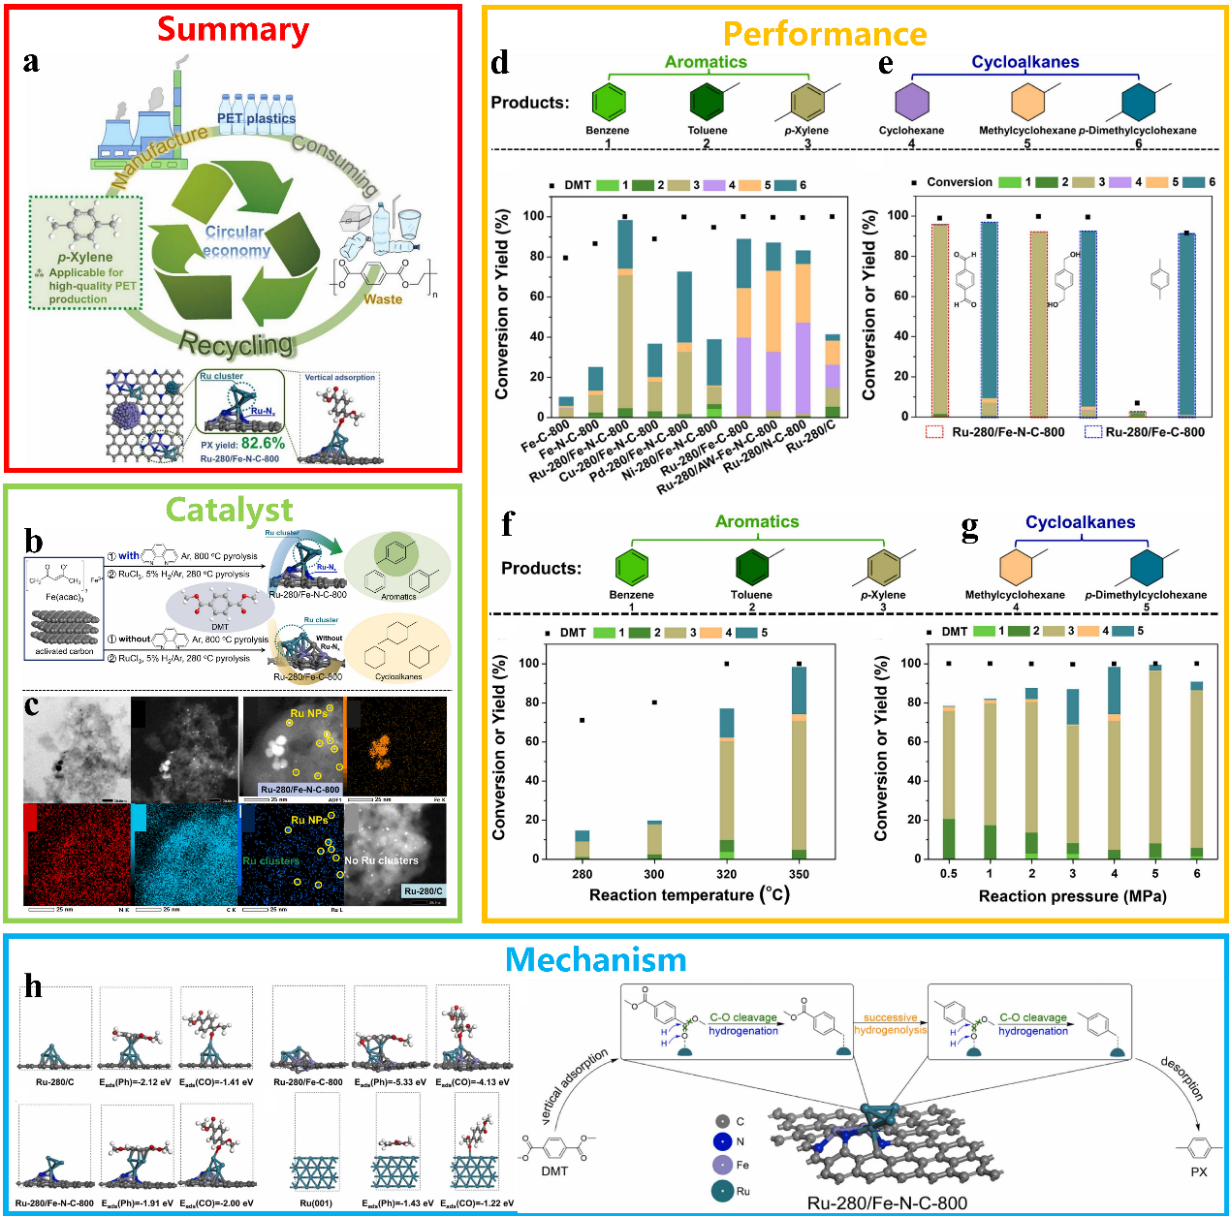
Fig. 13. (a) Schematic diagram of the HDO reaction using a RuFe bimetallic catalyst for the selective cleavage of C-C/C-O bonds to convert PET. (b) Schematic diagram of the synthesis of a RuFe bimetallic catalyst. (c) TEM, HRTEM and elemental mapping of the RuFe bimetallic catalyst. Factors affecting performance: catalyst (d,e), temperature (f), and pressure (g). (h) The adsorption configurations of DMT on different catalysts, their corresponding energies, and the possible reaction pathway for the HDO reaction. Reprinted with permission from Ref. [170]. Copyright 2024, Elsevier.
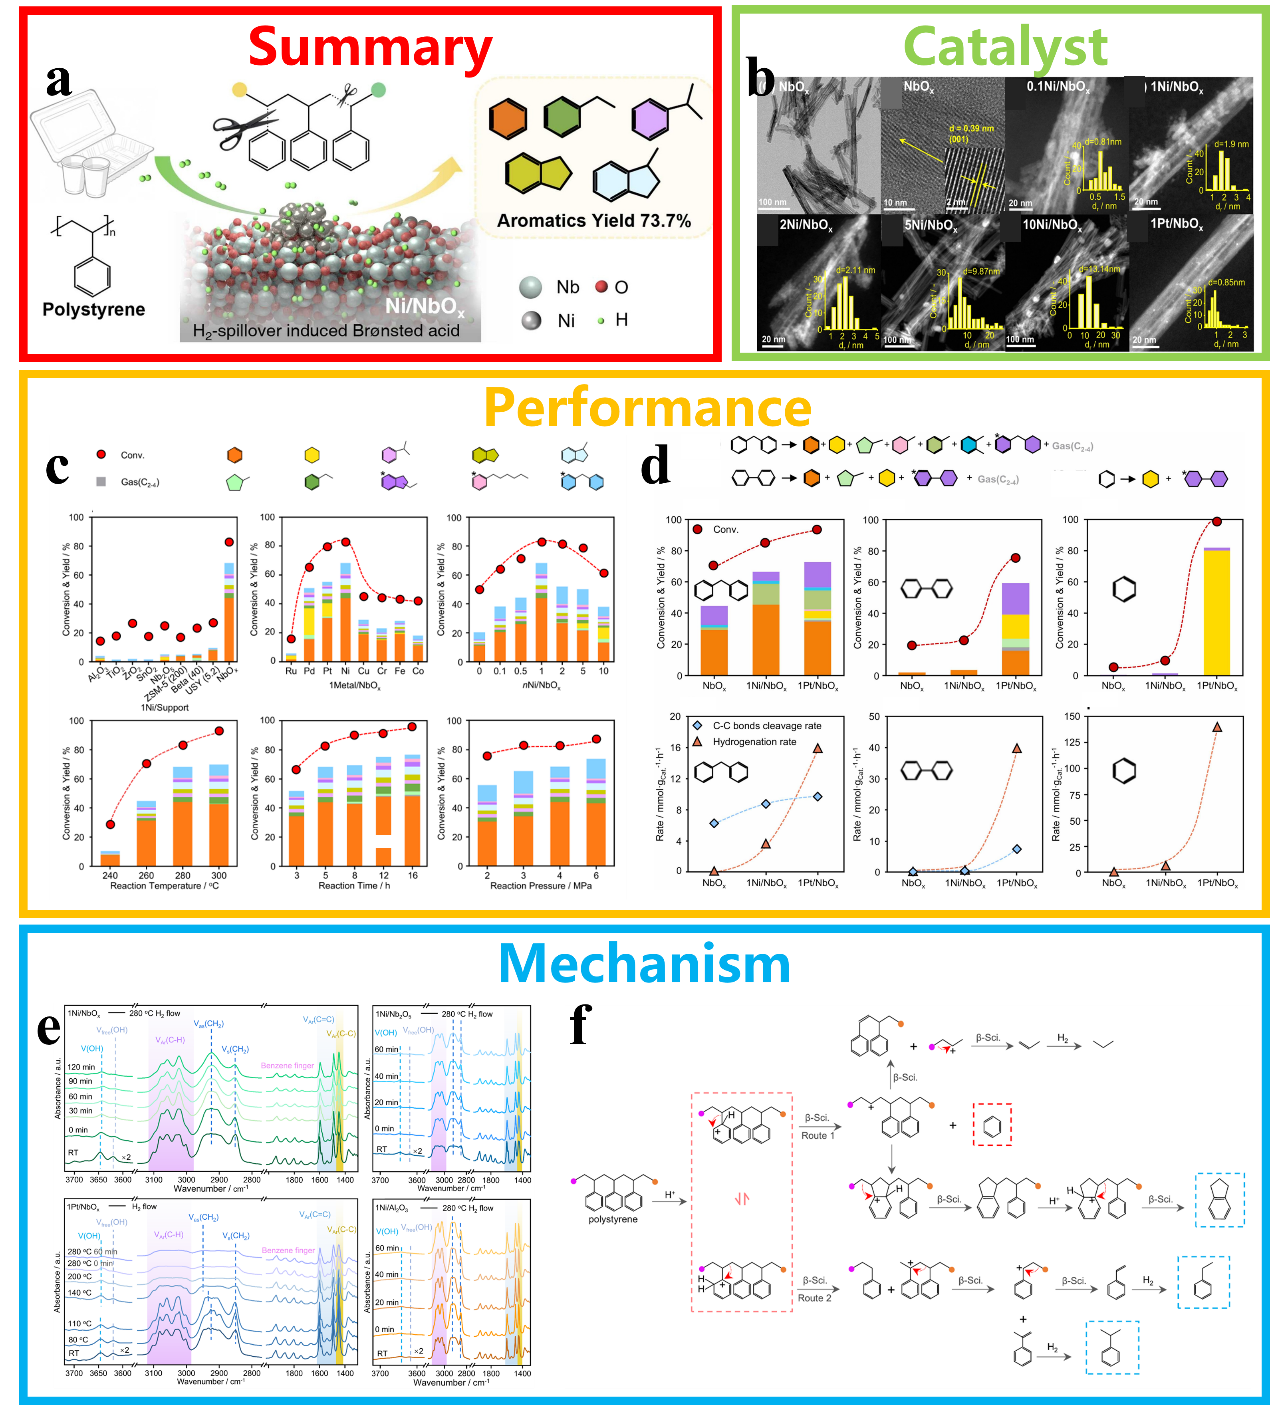
Fig. 14. (a) Schematic diagram of the conversion of PS plastic using a Ni/NbOx catalyst in a solvent-free system. (b) Morphology and particle size distribution of Ni/NbOx catalysts. (c) Comparison of the catalytic performance of Ni/NbOx with various reference catalysts in the hydrocracking of PS plastics. (d) Diagram of hydrogenation rates and C-C bond cleavage rates for different molecular models on different catalysts. (e) In-situ IR spectra of hydrocracked PS on various catalysts. (f) Possible pathway diagram for the hydrocracking of PS over 1Ni/NbOx catalyst. Reprinted with permission from Ref. [171]. Copyright 2026, Elsevier.
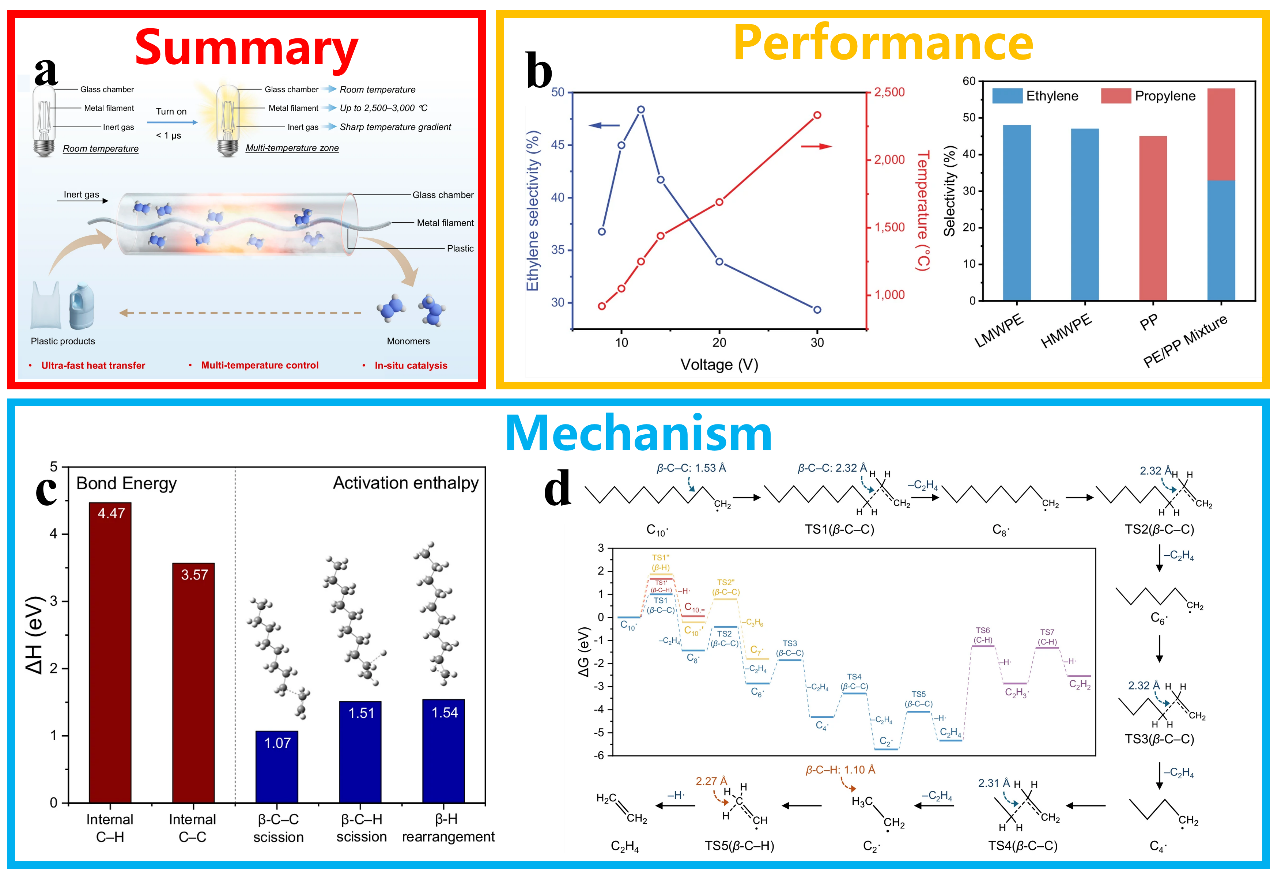
Fig. 15. (a) Schematic diagram of the depolymerisation of polyolefin plastics into monomers using high-temperature catalytic metal wires. (b) Performance diagram for depolymerised polyolefin plastics. (c) Bond breaking energies for β-C-C and β-C-H bonds obtained from DFT calculations. (d) The reaction free energy of the decomposition of the transition-state intermediate and the possible reaction pathways. Reprinted with permission from Ref. [172]. Copyright 2026, Springer Nature.

Fig. 16. (a) Schematic diagram of the conversion of waste PET plastic into CDs. (b-g) The effect of reaction temperature and catalyst loading on the yield of CDs with different fluorescent colours. (h) The pathway for converting PET into multicoloured CDs. Reprinted with permission from Ref. [173]. Copyright 2024, American Chemical Society.

Fig. 17. (a) Schematic diagram of the coupling between EGOR and HER/CO2RR/NO3RR in plastic conversion. Reprinted with permission from Ref. [27]. Copyright 2025, John Wiley and Sons. (b) Schematic diagram of the electrocatalytic conversion of EG on Pd NTs/NF. Reprinted with permission from Ref. [197]. Copyright 2023, American Chemical Society. (c) Schematic diagram of the electrocatalytic conversion of EG on NiCo2O4. Reprinted with permission from Ref. [199]. Copyright 2022, American Chemical Society. (d) Schematic diagram of the electrocatalytic conversion of EG on Co-Ni/CP. Reprinted with permission from Ref. [200]. Copyright 2024, John Wiley and Sons. (e) Schematic illustration of the electrocatalytic conversion of EG to FA on NiMn-LDH. Reprinted with permission from Ref. [201]. Copyright 2026, Elsevier. (f) Schematic diagram of the electrocatalytic conversion of EG on Mo-Ni3S2/NF. Reprinted with permission from Ref. [202]. Copyright 2026, Elsevier. (g) Schematic diagram of the electrocatalytic conversion of EG on CoFe-P/NF. Reprinted with permission from Ref. [203]. Copyright 2024, Elsevier. (h) Schematic illustration of the electrocatalytic conversion of EG on PdNi/Ni(OH)2 alloy catalyst. Reprinted with permission from Ref. [204]. Copyright 2026, Elsevier. (i) Schematic diagram of the electrocatalytic conversion of EG on NiFe LDH/MoSe2/NixSey/NF heterostructure electrocatalyst. Reprinted with permission from Ref. [205]. Copyright 2025, Elsevier.
| Catalyst | Plastic | Potential (V vs. RHE) | FE (%) | Products | Ref. |
|---|---|---|---|---|---|
| Pd NTs/NF | PET | 0.774 | 87.87 | glycolic acid | [ |
| NiCo2O4 | PET | 1.45 | 90 | formic acid | [ |
| Ni5Mn5 LDH | PET | 1.5 | 92.7 | formate | [ |
| Mo-Ni3S2/NF | PET | 1.38 | 95.6 | formate | [ |
| PdNi/Ni(OH)2 alloy | PET | 1.0 | 96.4 | glycolic acid | [ |
| NiFe LDH/MoSe2/NixSey/NF | PLA | 1.385 | — | CO2 | [ |
Table 4 Electrocatalytic conversion of plastics over different catalysts.
| Catalyst | Plastic | Potential (V vs. RHE) | FE (%) | Products | Ref. |
|---|---|---|---|---|---|
| Pd NTs/NF | PET | 0.774 | 87.87 | glycolic acid | [ |
| NiCo2O4 | PET | 1.45 | 90 | formic acid | [ |
| Ni5Mn5 LDH | PET | 1.5 | 92.7 | formate | [ |
| Mo-Ni3S2/NF | PET | 1.38 | 95.6 | formate | [ |
| PdNi/Ni(OH)2 alloy | PET | 1.0 | 96.4 | glycolic acid | [ |
| NiFe LDH/MoSe2/NixSey/NF | PLA | 1.385 | — | CO2 | [ |

Fig. 18. (a) Schematic diagram of electrochemical conversion to FA using a Ni2+-CoOOH3/NF nanosheet catalyst. (b) Schematic diagram of the synthesis of Ni2+-CoOOH3/NF nanosheet catalysts, TEM, HRTEM and elemental mapping images. (c) Device diagram for the electrocatalytic conversion of PET-derived EG. (d) FE and formate yield of Ni2+-CoOOH3/NF at different current densities. (e) FE and FA yield at different current densities in an MEA electrolyzer. (f) Chronopotentiometry test of HER||EGOR electrolyzer at 500 mA cm-2. (g) In-situ Raman spectroscopy for the Ni2+-CoOOH3/NF during EGOR test. (h) The operando FTIR spectra of Ni2+-CoOOH3/NF for EGOR. (i) The proposed conversion pathway of EG to FA over Ni2+-CoOOH3/NF. Reprinted with permission from Ref. [221]. Copyright 2025, Tsinghua University Press.

Fig. 19. (a) Schematic diagram of EG conversion in a dual-compartment flow electrolyser using AEM. SEM and HRTEM of Mn/CoOOH (b) and OV-rich BOC (c). (d) FE of the products. (e) Total FE and production rate of formate over the two-electrode integrated system under different current strengths. (f) Chronopotential curve of the two-electrode integrated system at a cell voltage of 2.2 V. (g) The gibbs free energy for EG oxidation over CoOOH and Mn/CoOOH. (h) Operando ATR-FTIR spectra for CO2 reduction at various potentials of BOC and OV-rich BOC. (i) The gibbs free energy for CO2 reduction over BOC and OV-rich BOC. Reprinted with permission from Ref. [222]. Copyright 2025, Elsevier.

Fig. 20. (a) Schematic diagram of the synergistic conversion of NO3RRand EGOR. (b) SEM, TEM and elemental mapping of catalysts. (c) FE of formate for the EGOR reaction. (d) FE and yield of NH3. (e) Performance comparison with other synergistic catalysis studies. (f) DOS of the CoCu LDH and Cu@CoCu LDH. (g) The Gibbs free energy diagrams of the NO3RR and EGOR over catalysts. Reprinted with permission from Ref. [223]. Copyright 2024, American Chemical Society.

Fig. 21. (a) Schematic diagram of the electrocatalytic conversion of EG to GA and H2. (b) Schematic diagram of catalyst preparation and TEM. (c) LSV curves of Pt-Ni(OH)2/NF and Ni(OH)2/NF in 1.0 mol L-1 KOH and 0.1 mol L-1 EG. (d) Comparison of applied potentials for attaining different current densities during EGOR. (e) 1H NMR of the conversion product. (f) FE of EGOR on Pt-Ni(OH)2/NF under different applied potentials. (g) In-situ FTIR spectra of Pt-Ni(OH)2/NF in an EGOR at various potentials. (h) Gibbs free energy of the EGOR process for different catalysts. Reprinted with permission from Ref. [225]. Copyright 2024, American Chemical Society.

Fig. 22. (a) Schematic diagram comparing methods for synthesizing amide products. (b) Schematic illustration of the electrocatalytic C-N coupling reaction converting EG into amide products. (c) Diagram of MnO2/CFP catalyst synthesis, TEM and elemental mapping. (d) FE of EGOR at different potentials. (e) FEs and yields of products at potentials from 1.1 to 1.4 V vs. Ag/AgCl. (g) FEs and yields of products resulting from the electrocatalytic conversion of PET bottles. (f) 1H NMR spectra of the product in different electrolyte solutions. (h) Gibbs free energy diagram illustrating the electrocatalytic C-N coupling of EG with NH3 on a MnO2/CFP catalyst to produce glycolamide and FA. (i) Proposed electrocatalytic C-N coupling reaction mechanism between EG and NH3. Reprinted with permission from Ref. [229]. Copyright 2025, American Chemical Society.
| Catalyst | Plastic | Conditions | Products | Ref. |
|---|---|---|---|---|
| S238F/W159H | PET, PEF | 30°C, pH=7.2, 96 h | MHET | [ |
| GS115/PETase-HFBI | PET | 40 °C, pH=9.0 | LcPET | [ |
| IsPETase/DAA | PET | 35-50 °C, pH=5-10, 4 h | MHET | [ |
| P367A/L381A | PET | 45 °C, pH=10.0, 48 h | TDA | [ |
| FAST-PETase | PET | 50 °C, pH=8, 11 d | TPA | [ |
| Arthrinium phaeospermum LF2024 | PLA | 28 °C, LC-MSM, 40 d | glyoxylic acid, 2,3-pentanedione, propionic acid, etc. | [ |
| Nitrifying-denitrifying microbial community | PP | 35 °C, pH=8.5, 42 d | — | [ |
Table 5 Biocatalytic conversion of plastics over different catalysts.
| Catalyst | Plastic | Conditions | Products | Ref. |
|---|---|---|---|---|
| S238F/W159H | PET, PEF | 30°C, pH=7.2, 96 h | MHET | [ |
| GS115/PETase-HFBI | PET | 40 °C, pH=9.0 | LcPET | [ |
| IsPETase/DAA | PET | 35-50 °C, pH=5-10, 4 h | MHET | [ |
| P367A/L381A | PET | 45 °C, pH=10.0, 48 h | TDA | [ |
| FAST-PETase | PET | 50 °C, pH=8, 11 d | TPA | [ |
| Arthrinium phaeospermum LF2024 | PLA | 28 °C, LC-MSM, 40 d | glyoxylic acid, 2,3-pentanedione, propionic acid, etc. | [ |
| Nitrifying-denitrifying microbial community | PP | 35 °C, pH=8.5, 42 d | — | [ |

Fig. 23. (a) Schematic diagram of the general mechanism of the bioconversion of PET plastic. Reprinted with permission from Ref. [238]. Copyright 2025, Elsevier. (b) Structures of two enzymes used in PET hydrolysis. Reprinted with permission from Ref. [240]. Copyright 2018, National Academy of Sciences. (c) Schematic diagram of the Pastoris GS115/PETase-HFBI combined display system. Reprinted with permission from Ref. [241]. Copyright 2022, Springer Nature. (d) Schematic diagram illustrating the conversion of PET plastic using PET-degrading enzyme LCC and its variants, modified via plasmid or genomic integration. Reprinted with permission from Ref. [242]. Copyright 2025, Elsevier. (e) A novel urethanase-5-P367A/L381A developed using a phylogeny-based enzyme screening approach. Reprinted with permission from Ref. [243]. Copyright 2025, American Chemical Society. (f) Engineered E. coli with truncated FadL to surface-display PETase and BaCBM, yielding renewable whole-cell biocatalyst D-HLCB. Reprinted with permission from Ref. [244]. Copyright 2024, Elsevier. (g) The new PLA bio-degradable agent Arthrinium phaeospermum. Reprinted with permission from Ref. [245]. Copyright 2025, Elsevier. (h) Microbial biotransformation of MP on face masks by a symbiotic bacterial community capable of both nitrification and denitrification. Reprinted with permission from Ref. [246]. Copyright 2024, Elsevier.
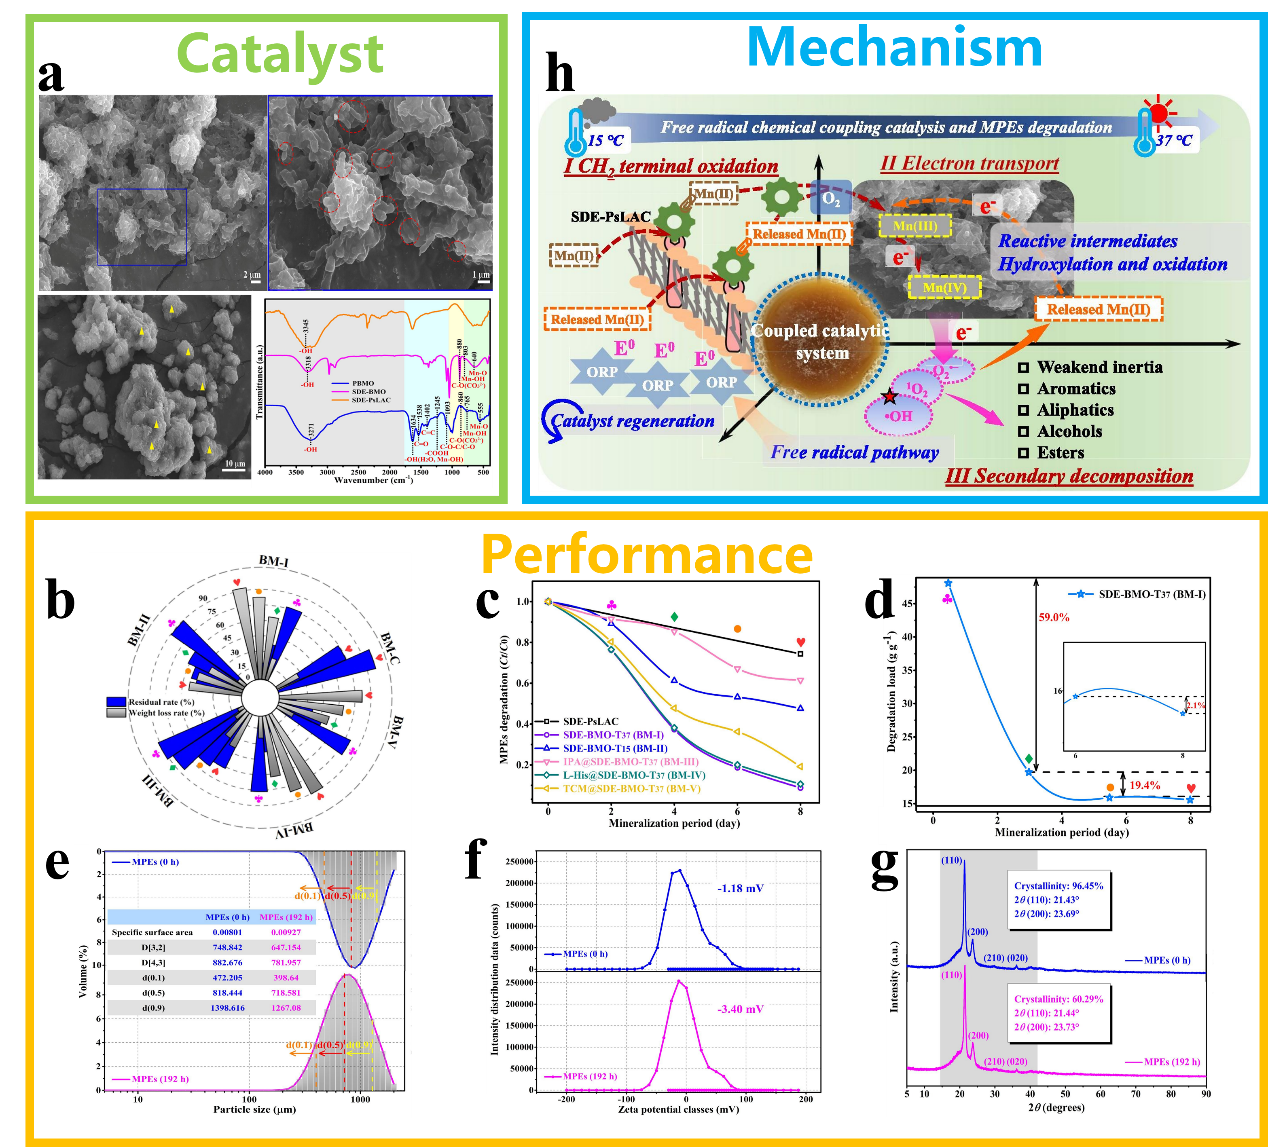
Fig. 24. (a) Morphology of the SDE-BMO catalyst. The performance of catalysts in the degradation of plastics BM series (b) and SDE-BMO series (c). (d) Change in degradation load (BMO amount loading per unit of MPEs substrate) during cultivation time of SDE-BMO-T37. (e) Comparison of MPE particle sizes before and after degradation. (f) Comparison of zeta potential values and distribution before and after degradation. (g) Comparison of XRD before and after degradation. (h) Proposed mechanism of MPEs removal by the SDE-BMO coupled system. Reprinted with permission from Ref. [264]. Copyright 2025, Elsevier.
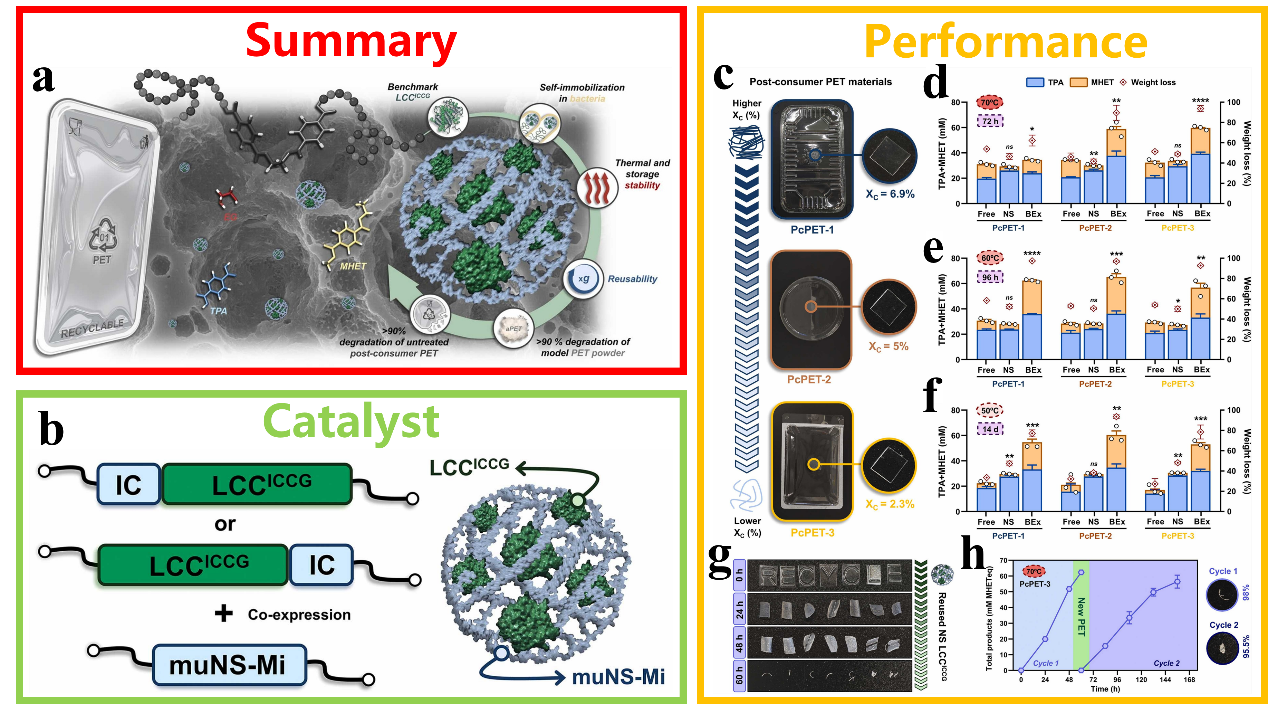
Fig. 25. (a) Schematic diagram of PET plastic conversion by LCCICCG hydrolase. (b) Schematic diagram of the synthesis of IC-tagged LCCICCG and enzyme-containing nanospheres. (c) Untreated post-consumer PET for degradation testing. (d‒f) Comparison of PET hydrolysis activity under different conditions. (g) The degradation performance of reused LCCICCG on PcPET-3 at 70 °C. (h) Performance of reused immobilized LCCICCG after two cycles at 70 °C. Reprinted with permission from Ref. [265]. Copyright 2025, Elsevier.
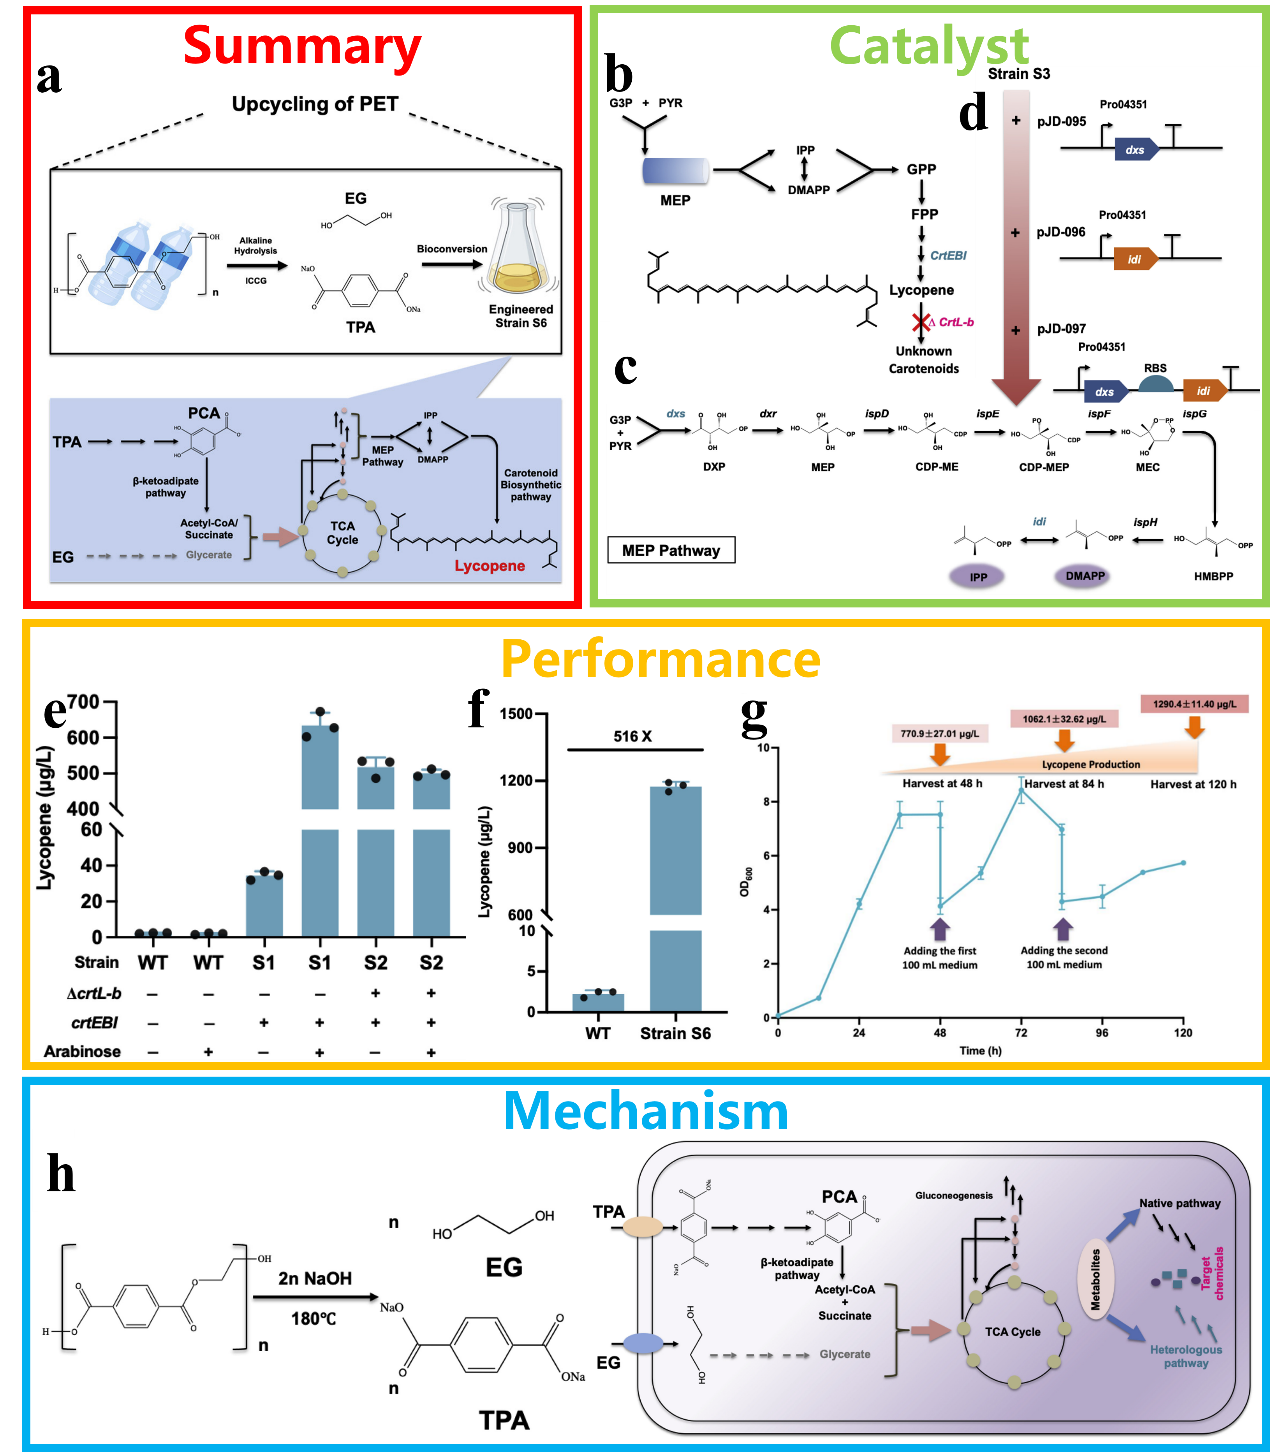
Fig. 26. (a) Schematic diagram of a microbial system converting PET into value-added chemicals. (b) Process flow diagram for the synthesis of lycopene via the modification of endogenous carotenoid-producing organisms. (c) Schematic of the endogenous MEP pathway. (d) Schematic overview of the overexpression of the key genes in the MEP pathway. (e) HPLC analysis of lycopene production in RPET and its derivative strains. (f) Performance of WT and strain S6 in the conversion of PET to lycopene. (g) Fed-batch fermentation in shake flasks for lycopene production using PET hydrolysate. (h) The mechanism by which PET hydrolysate is converted into lycopene on RPET. Reprinted with permission from Ref. [266]. Copyright 2023, Elsevier.

Fig. 27. (a) Schematic diagram of conformation selection in the biocatalytic degradation of plastics by PETase. (b) The overall structure of IsPETase (PDB ID: 6EQE). (c) Comparison of PETase activity across different substrate conformations and particle sizes. (d) Possible mechanisms underlying cross-substrate preference in the S238A mutant. Reprinted with permission from Ref. [267]. Copyright 2025, American Chemical Society.
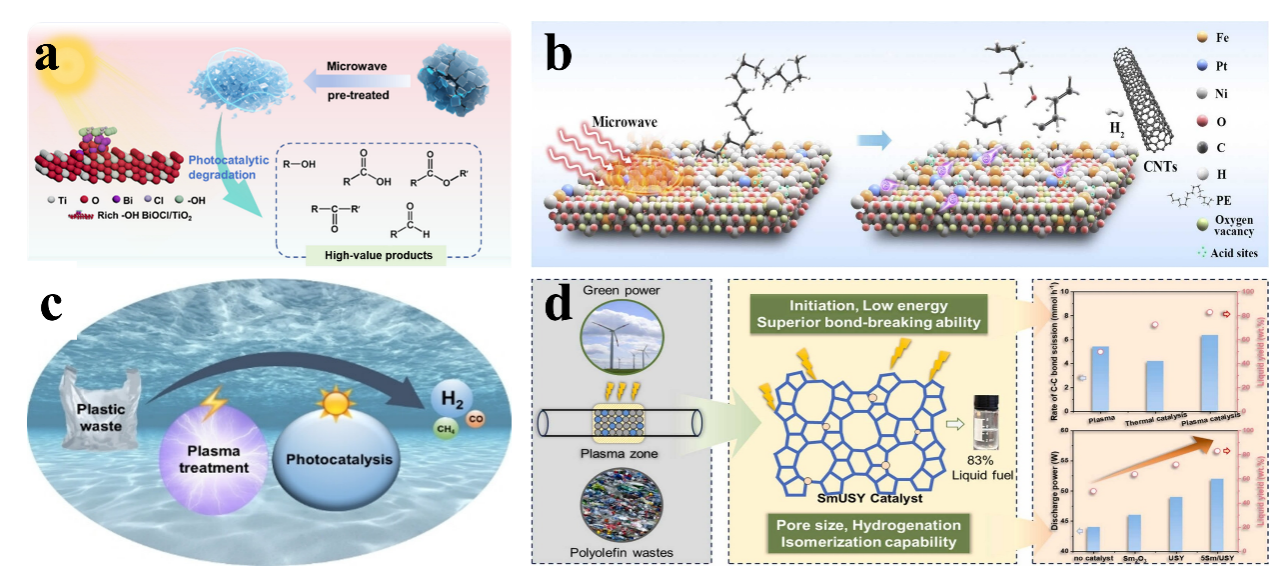
Fig. 28. (a) Microwave treatment combined with photocatalytic degradation of HDPE plastic. Reprinted with permission from Ref. [275]. Copyright 2025, Elsevier. (b) Microwave-assisted thermocatalytic conversion of LDPE to CNTs on a Pt-promoted Fe/Ni bimetallic catalyst. Reprinted with permission from Ref. [278]. Copyright 2026, Elsevier. (c) Photocatalytic conversion of plasma-treated PE on Pt/TiO2. Reprinted with permission from Ref. [279]. Copyright 2023, John Wiley and Sons. (d) Plasma-catalysed conversion of PE into fuel over Sm/USY. Reprinted with permission from Ref. [280]. Copyright 2026, Elsevier.

Fig. 29. (a) Schematic diagram of the photothermal degradation of plastics in an air-plastic-catalyst system. Reprinted with permission from Ref. [291]. Copyright 2024, John Wiley and Sons. (b) Schematic diagram of photothermal catalytic conversion of PE to propionic acid. Reprinted with permission from Ref. [292]. Copyright 2025, American Chemical Society. (c) Photocatalysis converts PET and CO2 into high-value products. Reprinted with permission from Ref. [293]. Copyright 2025, Elsevier. (d) Enzyme-assisted photocatalytic conversion of polyester plastics into fuels and chemicals. Reprinted with permission from Ref. [294]. Copyright 2023, American Chemical Society. (e) Synergistic conversion of PE plastic into microbial lipids via catalytic pyrolysis and biotransformation. Reprinted with permission from Ref. [295]. Copyright 2023, Elsevier.
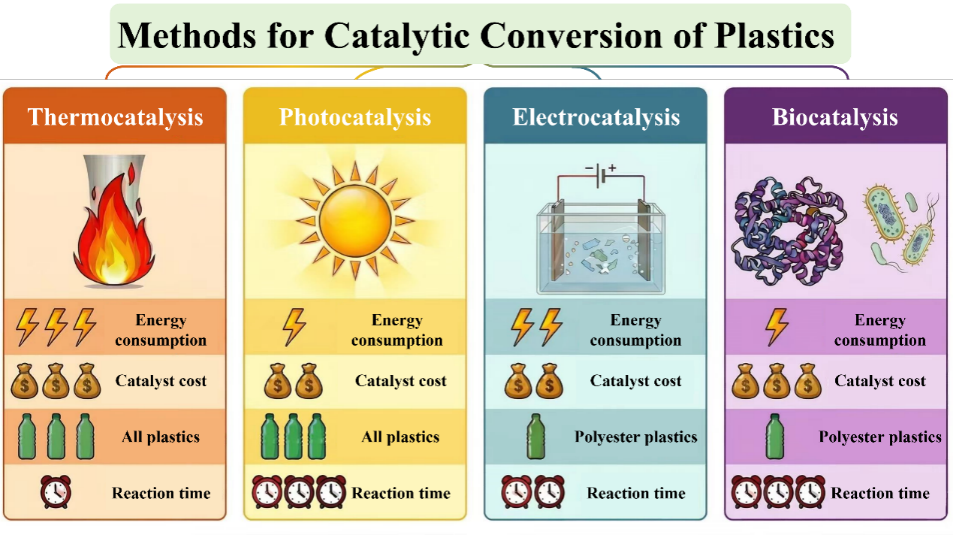
Fig. 30. A summary of various catalytic technologies used in the recycling of plastic waste.
|
| [1] | 李思娴, 段有雨, 梁新元, 李宇涵, 张蝶青. 光催化活性位点的原子结构解析与调控: 从精准识别到理性设计[J]. 催化学报, 2026, 83(4): 1-23. |
| [2] | 张恒, 张泽宇, 侯坤明, 贾霖, 郭颖昕, 李昊润, 邹梦波, 孙宪虎, 曾尚红. 铜表面的氢氧化镨纳米棒通过相互作用和几何变形产生不对称的活性中心用于CO2电还原反应[J]. 催化学报, 2026, 90(11): 158-168. |
| [3] | 张朋祥, 王佳雯, 杨天宇, 王瑞哲, 沈若凡, 彭智昆, 刘艳艳, 武现丽, 蒋剑春, 李保军. 揭示复杂性: 析氧反应机理研究进展[J]. 催化学报, 2025, 72(5): 48-83. |
| [4] | 刘青, 尚进, 刘振东. 塑料废弃物升级回收时代的分子筛催化剂: 迈向循环经济与可持续发展[J]. 催化学报, 2025, 71(4): 54-69. |
| [5] | 张丽娜, 刘国威, 邓欣妍, 李秋叶, 杨建军. 原子分散的Ba位点作为电子促进剂增强Cu助催化剂的光还原CO2性能[J]. 催化学报, 2025, 70(3): 341-352. |
| [6] | 王立娜, 纳木汗, 杜若菲, 王秀锦, 于博洋, 杨岚, 陈辉, 邹晓新. 超薄二维电催化剂: 构效关系、催化机制及水电解槽应用[J]. 催化学报, 2025, 77(10): 4-19. |
| [7] | 郎程广, 许彦桐, 姚向东. 通过缺陷优化析氢反应电催化剂: 最新研究进展与展望[J]. 催化学报, 2024, 64(9): 4-31. |
| [8] | 刘露杰, 刘奔, 中川善直, 刘斯宝, 王亮, 藪下瑞帆, 冨重圭一. 生物质和塑料加氢脱氧制备燃料和化学品的双金属催化剂研究进展[J]. 催化学报, 2024, 62(7): 1-31. |
| [9] | 王元男, 王立娜, 张可新, 徐靖尧, 武倩楠, 谢周兵, 安伟, 梁宵, 邹晓新. 钙钛矿氧化物在水裂解反应中的电催化研究[J]. 催化学报, 2023, 50(7): 109-125. |
| [10] | 冯业芹, 秦琳, 张峻豪, 符方玉, 李慧杰, 相华, 吕红金. 轮型二十核铜取代多金属氧酸盐催化剂: 光催化制氢的机理和稳定性研究[J]. 催化学报, 2022, 43(2): 442-450. |
| [11] | 杨辰昕, 陈鹤南, 彭焘, 梁柏耀, 张云, 赵伟. 电催化木质素升级转化成高附加值化学品和燃料的研究进展[J]. 催化学报, 2021, 42(11): 1831-1842. |
| [12] | 胡忠攀, 杨丹丹, 王政, 袁忠勇. 丙烷直接脱氢催化剂的研究进展[J]. 催化学报, 2019, 40(9): 1233-1254. |
| [13] | 红婧, 陈鹏, 袁小亚, 张育新, 黄洪伟, 王里奥, 董帆. 人工氧缺陷对提高Bi2O2CO3纳米片光催化活性和选择性的关键作用[J]. 催化学报, 2019, 40(5): 620-630. |
| [14] | 王永霞, 左明辉, 李悦生. 水杨醛亚胺钒(Ⅲ)化合物催化乙烯聚合反应机理[J]. 催化学报, 2015, 36(4): 657-666. |
| [15] | 杜玉, 汤丹丹, 张高科, 吴晓勇. Ag2O-TiO2/海泡石复合光催化剂制备及其可见光光催化性能[J]. 催化学报, 2015, 36(12): 2219-2228. |
| 阅读次数 | ||||||
|
全文 |
|
|||||
|
摘要 |
|
|||||


